Introduction: what the Levelling Up White Paper seeks to achieve
The Levelling Up White Paper (LUWP) published on 2 February 2022 makes the case for investment in six capitals (human, financial, social, physical, intangible and institutional), which it argues underpin economic and social development (HM Government, 2022). These capitals are inter-related: for example, financial capital is required for investment in other capitals. There are also capitals which are not included, for example natural or environmental capital, although the LUWP argues that these are picked up by other policies (HM Treasury, 2021; Dasgupta, 2021). This absence is surprising, especially considering the attention they were given in a publication on which the LUWP draws to develop its ‘capitals’ approach (Coyle et al., 2019). As the base upon which all other economic activity can proceed, our attention here is specifically with the role of physical capital in levelling up and its treatment by the White Paper. This paper focuses on one capital – physical capital – and, whatever the fate of levelling up as a policy agenda, why it is an important part of understanding and addressing regional inequality in the UK.
The LUWP includes an analysis of Gross Fixed Capital Formation (GFCF) and highlights that correcting regional imbalances could be a key element of levelling up. GFCF is an estimate of physical capital investment by all sectors (both public and private). It includes spending on plant and machinery, ICT equipment and software, as well as areas such as the construction and improvement of buildings, roads, railways, and underground infrastructures such as sewer and cable networks. Requirements for fixed capital will vary by sector in terms of scope and scale – for instance, a software company will require ICT investment whilst a petrochemical works will have a huge requirement for plant and machinery. How this capital is used can matter as much as how much capital there is; thus, more highly skilled workers may get more from the capital in terms of output than less skilled workers. The amount of physical capital may grow due to domestic investment but also from foreign direct investment (FDI). Physical capital reflects investment in assets which will bring long term benefits to an economy – in the case of large plant or buildings this may be over 50 years or more.
Surprisingly the LUWP says relatively little as to why physical capital is important to levelling up. In terms of the medium-term aspirations of the LUWP’s mission on productivity the focus is primarily on spreading research and development expenditure, investment in public transport outside London, and in providing high-speed broadband and 5G. Little is said about what might be seen as traditionally important parts of GFCF such as renewing and modernising the built environment and upgrading plant and machinery across different sectors; nor how physical capital is required to meet future economic drivers, such as automation. The approach the LUWP takes is to seek to facilitate investment through improving quasi-public financial support for SMEs (such as the British Business Bank) and by unlocking institutional investment, with the role of pension schemes (such as the Local Government Pension Scheme) highlighted as an opportunity to better align these funds with investment in projects that will have local and regional benefits.
Prima facie this seems like a limited approach. The next section explores these issues further and considers why fixed capital matters for levelling up and more broadly for economic and social development.
Why Physical Capital Matters
GFCF, as the main measure of physical capital, varies markedly between countries, in part reflecting their stage of development (for instance, rapidly industrialising countries would be expected to have higher GFCF than an already industrialised country). This emerges clearly from the trends shown in Figure 1. Hence, since 2000 China’s GFCF has on average been 40 per cent of GDP (and rising) – although in part this is due to considerable expansion of urban housing, Germany and France just over 20 per cent (and constant) and that of the UK around 17 per cent (and slowly falling, as well as lagging behind the USA for the last 30 years). The differences between the UK, France and the UK may be partly explained by sectoral mix – with Germany and France having larger manufacturing sectors and historically larger public programmes of investment in areas such as transport infrastructure. There is evidence that higher levels of physical capital investment lead to higher levels of growth (De Long and Summers, 1991), although it should be stressed that other factors are also important (Lipsey and Kravis, 1987), including investment in the other capitals.
Figure 1: GFCF in Five Countries
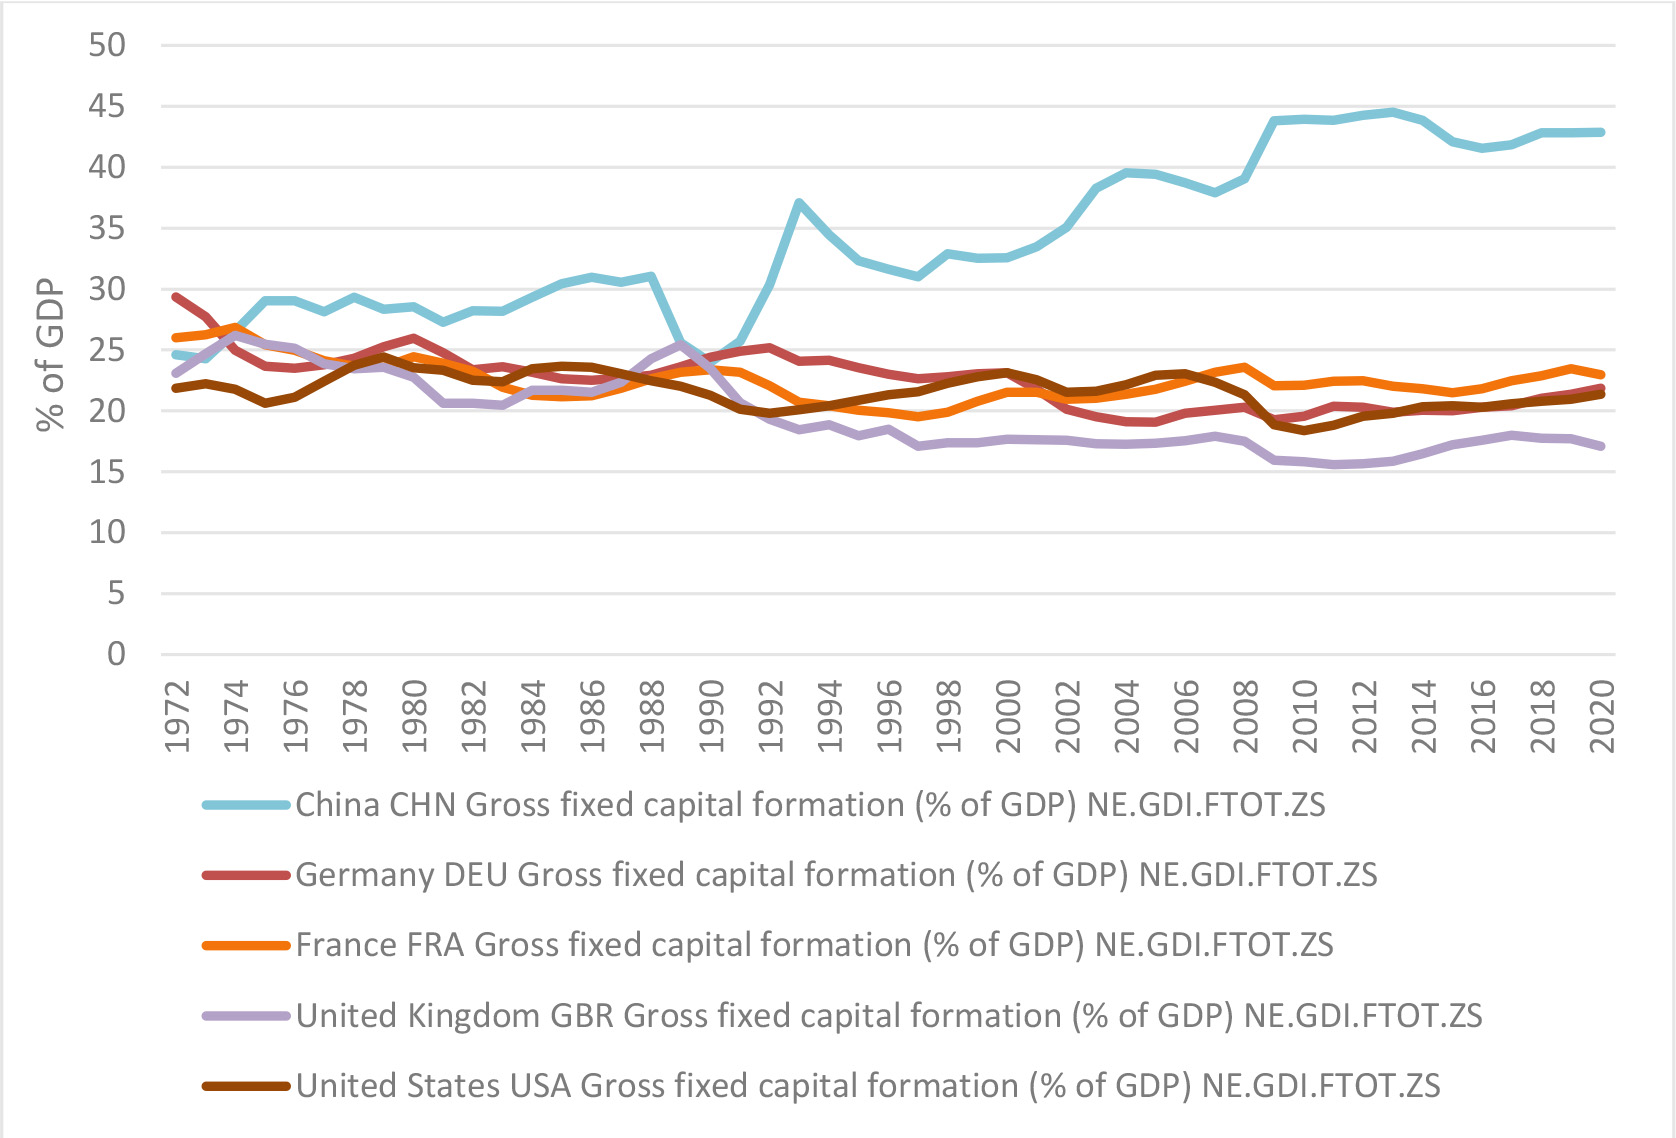
Source: World Bank Data, accessed on 17th June 2022: https://data.worldbank.org/indicator/NE.GDI.FTOT.ZS
Authors such as Blomström et al. (1996) have also raised questions around causation: for example, is it higher levels of physical capital investment which lead to growth or vice versa? As these authors conclude: ‘Institutions, economic and political climate, and economic policies that encourage education, inflows of direct investment, lower population growth, and the efficient use of investment seem to be the chief foundations for economic growth’ (ibid., 276). However, at the very least GFCF is a good indicator of the investment by which these policies and their attendant institutional frameworks lay the foundations for growth. As Rodríguez-Pose and Ketterer (2020) show, there may be differences between nations and regions in terms of investment needs. Thus, in southern EU regions improvements in governance and institutions are needed to make effective use of investment, whereas in central and eastern EU regions increases in total investment are required to compensate for the neglect of the late Warsaw Pact years.
What’s going on in the UK?
What is striking about the UK is that there has been a distinct spatial pattern of physical capital expenditure since at least 2000. Table 1 compares regional GFCF (our preferred measure of investment in physical capital) to the UK average between 2000 and 2018 and shows the ‘winners’ and ‘losers’ over this time, colour-coded into black and red type respectively. The pattern that emerges largely reflects a north-south divide. London, the South East and East of England have been running ahead of the UK average for the entirety of this period. At the same time there are a couple of outliers: Scotland which has consistently seen higher levels of GFCF for 20 years than all other regions bar London, although some evidence suggests that this is due to continued investment in North Sea oil and gas in North East Scotland/Aberdeen region (Gardiner et al., 2020); and Northern Ireland which appears to have benefited from a ’peace dividend’ for GFCF, at least during the first decade of the 2000s. Wales, the Midlands and the North of England have all lagged behind the South of England and Scotland. This is largely an extension of the analysis in the LUWP (p.76), although we have extended it by looking at different time periods. The disparities have persisted between the time of the New Labour (1997-2010) and the Coalition/Conservative (2010-present) governments, albeit on a much larger scale during the more recent years of austerity-based policies.
Table 1: Total Surplus or Deficit GFCF Relative to UK Total, 2000-2018
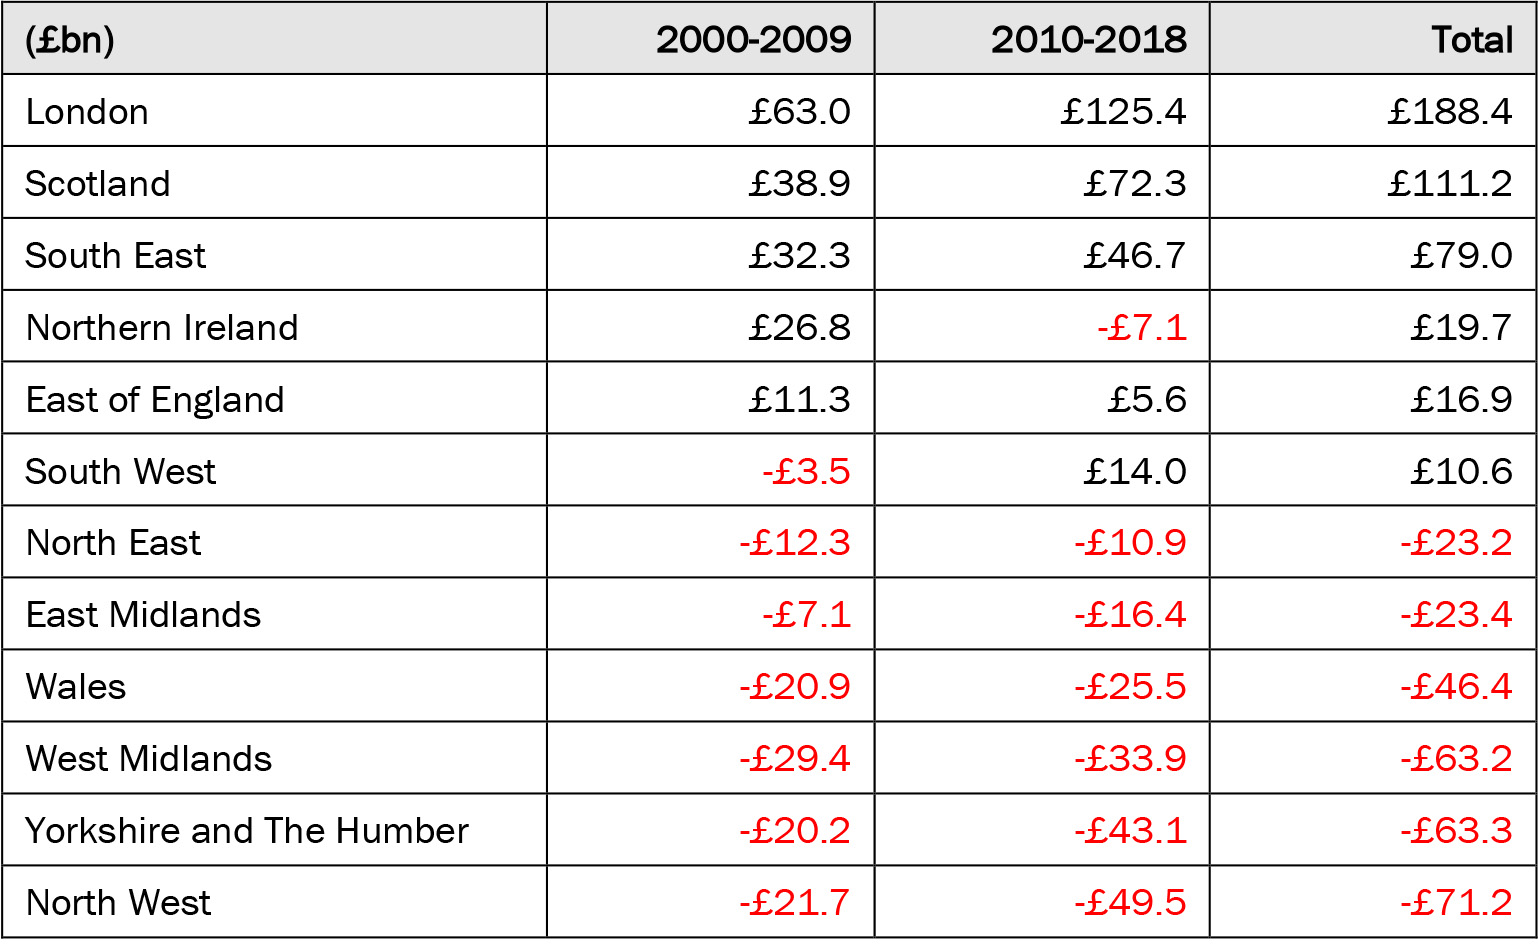
Source: Estimates of Regional Gross Fixed Capital Formation, NUTS1 and NUTS2, 2000 to 2018, ONS.
Note: Calculations are based on the amount each region or country would have received had this been the same as the UK overall in per capita terms, compared with what they actually received. Figures may not sum due to rounding.
We have also examined investment differentials between countries and regions on a per capita basis (Table 2). This reveals similar overall patterns but also amplifies the scale of what appears to be the Northern Ireland peace dividend in the early 2000s, and also just how well London and Scotland have fared compared to the rest of the UK.
Table 2: Per Capita Surplus or Deficit GFCF Relative to UK Average, 2000-2018
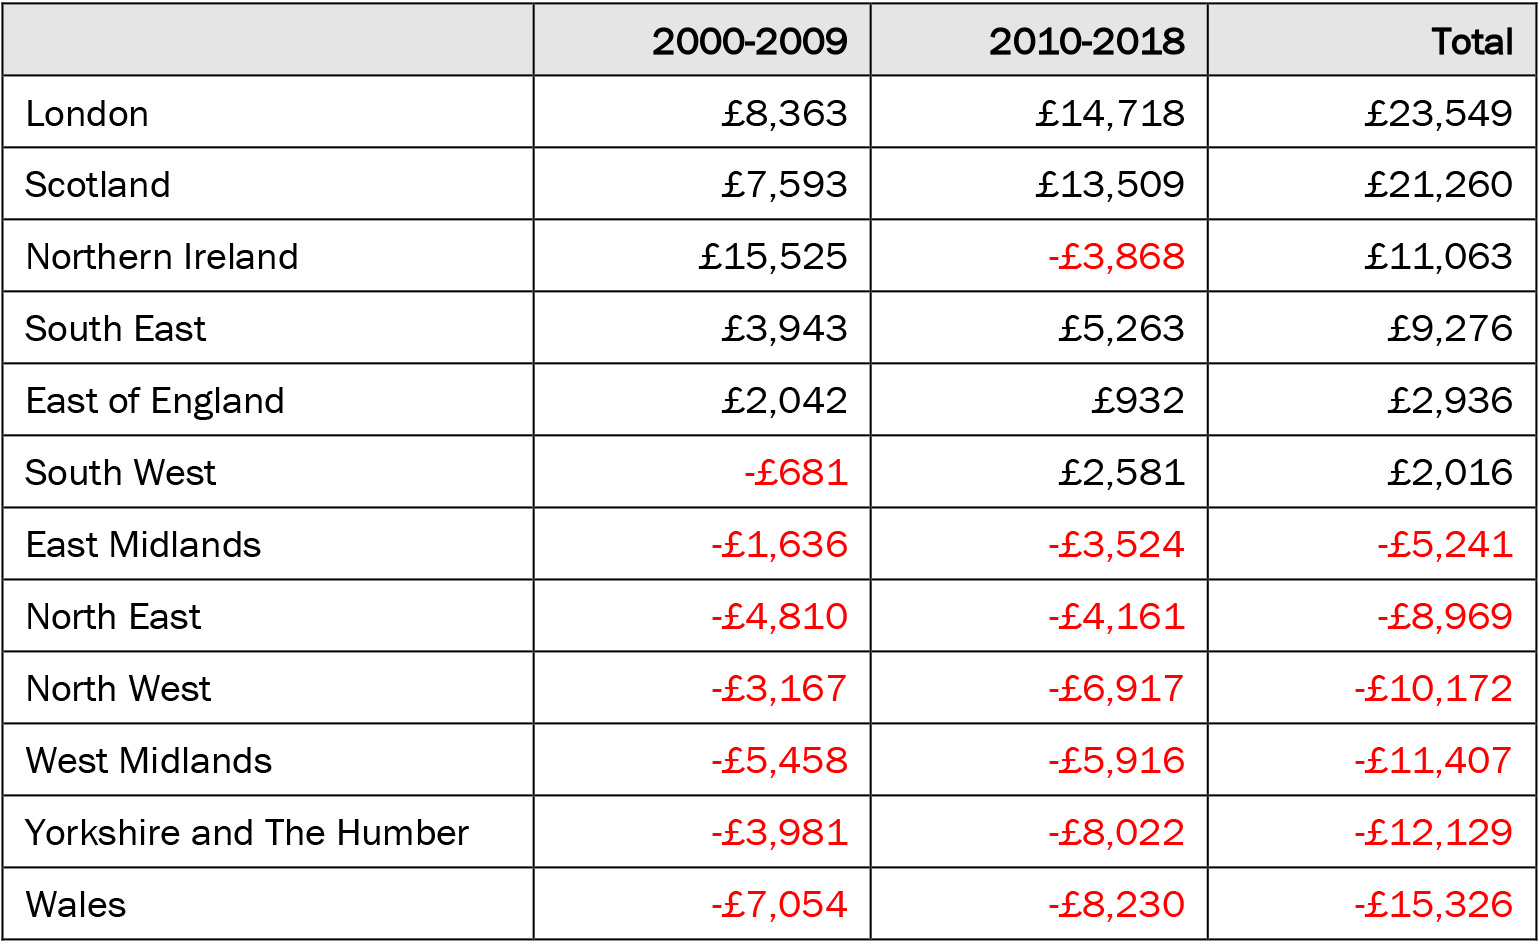
Source: Estimates of Regional Gross Fixed Capital Formation, NUTS1 and NUTS2, 2000 to 2018, ONS.
Note: Calculations are based on average population for the different periods (based on annual mid-year estimates), hence the individual values do not sum to the totals for each region or country.
The two tables highlight the scale of the challenge for levelling up. From a path dependency perspective (Hassink et al., 2019), turning around these patterns of investment will be very challenging, even by the end of the decade. The analysis raises major questions around the extent to which such disparities might be addressed. Moreover, it raises the question of whether the focus should be on changing the conditions which promote greater GFCF (as Blomström et al. (1996) would argue), or whether it would be better to use subsidies and incentives to stimulate greater physical capital investment (e.g., in the industries identified in the UK’s previous Industrial Strategy) and adopt related measures to address poor productivity.
Research led by Ben Gardiner (Gardiner et al., 2020; 2021) has attempted to untangle the relationship between capital stocks and productivity at a regional level. It shows that capital intensity (capital stock per capita) does have a positive effect on labour productivity, especially in manufacturing sectors, where the authors point to the rising significance of automation. They also note that investment in business services, especially in information and communication technologies (ICT), may understate the significance of the actual role of investment in promoting labour productivity growth. In simple terms ICT investment can have a transformative effect on business activity, although evidence from the last 15 years suggests that the benefits of the ICT revolution have not yet been realised in higher levels of economic growth (van Ark et al., 2021). Unravelling the relationship between investment in capital and in skills is a key challenge in addressing the ‘productivity puzzle’ (Haldane, 2017) in the UK. In brief, this refers to the UK phenomenon where 20 to 25 per cent of firms are more productive than comparators in the same quintiles and quartiles in similar industrialised countries, whilst the remainder lag behind their international equivalents on the same indicator. This points to the risk of a ‘two speed’ economy, although Haldane is keen to stress that the most productive firms are found in all regions of the UK.
Why do regional variations persist?
It is not within the scope of this paper to explore in depth why such differences in regional GFCF might exist, but it is possible to draw a stylized account of some of the broad factors behind the divergence. Firstly, we are seeing a continual sectoral shift playing out in the UK with a decline in the proportionate share of manufacturing and a continued rise of services, with what are seen as productive service functions in finance and other professions concentrated in London and to some extent in cities such as Edinburgh. Secondly, as Table 3 shows, the older industrial regions received lower shares of public expenditure during the austerity years between 2010 and 2020, both overall and in terms of capital investment. At the same time London and surrounding regions benefitted from growing portions of what was effectively a smaller pie. This was not just from welfare budgets and local authority spending but also in terms of the scale of regional development funding and the role of regional and local economic development infrastructures (Gray and Barford, 2018). The Local Enterprise Partnerships (LEPs) have been poor replacements in scale and scope to the Regional Development Agencies (RDAs), despite the rise in City Deal type funding.
Table 3: Regional Shares of Public Expenditure in the UK, 1999/2000 to 2019/2020
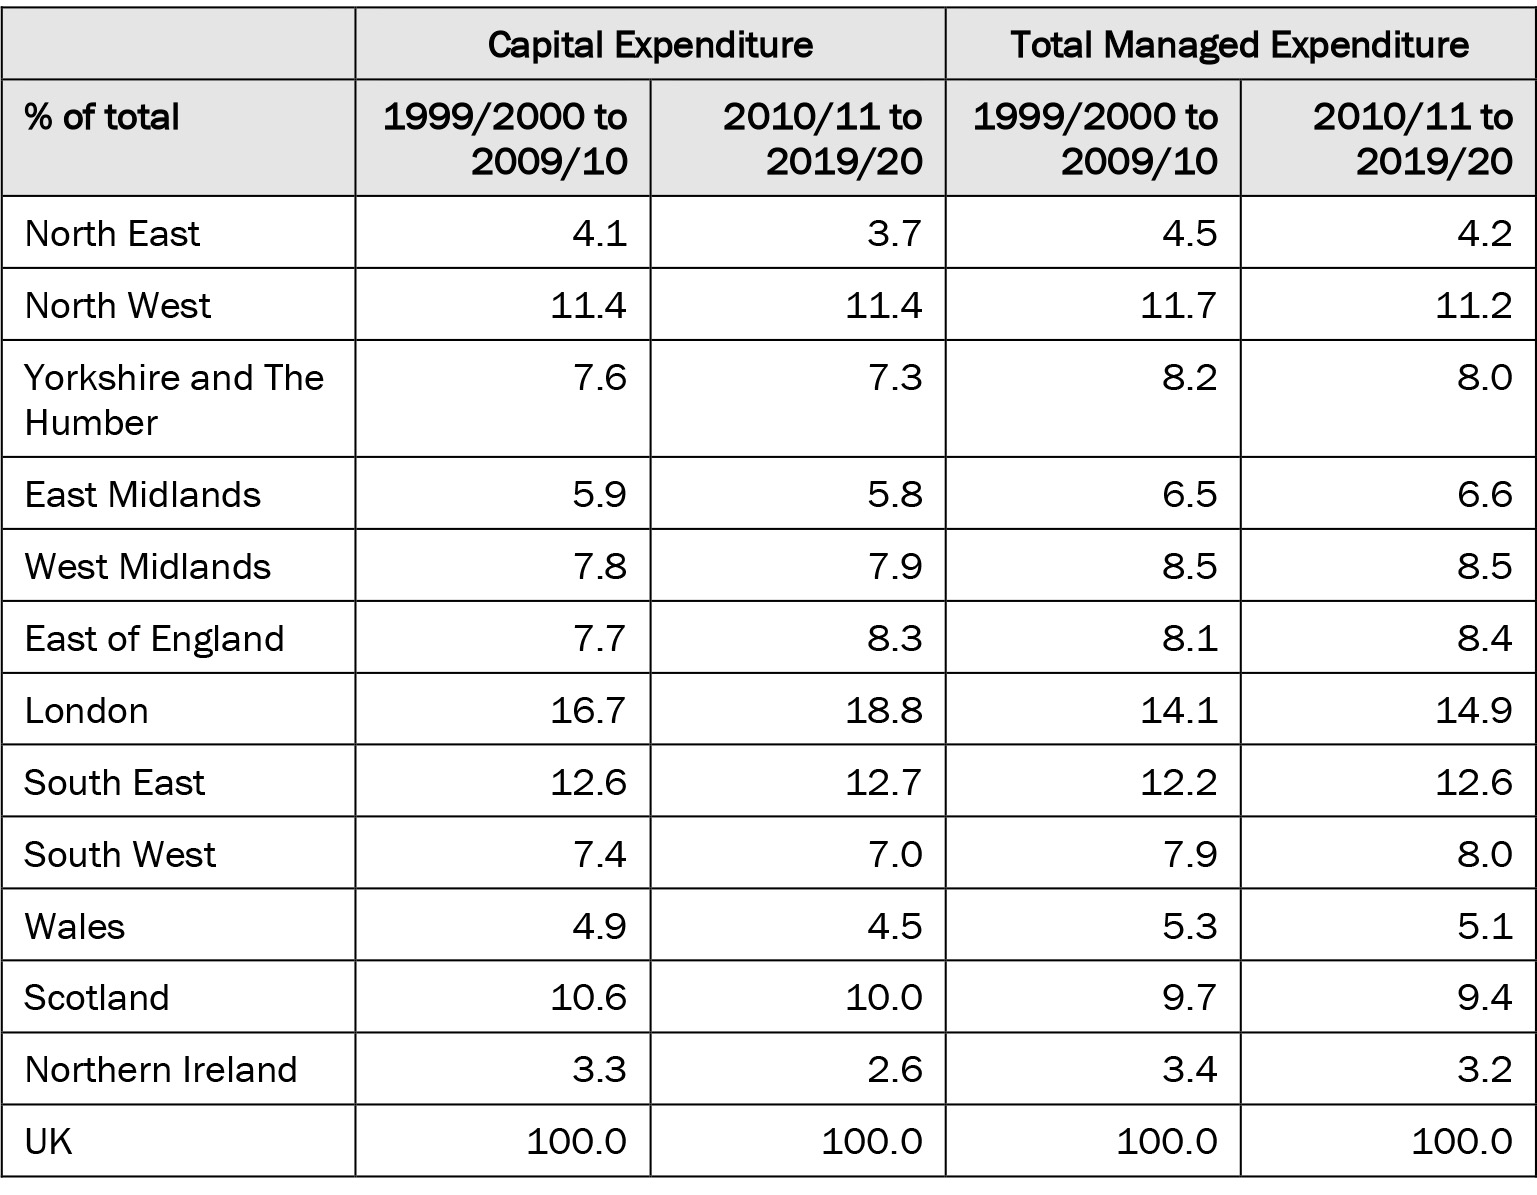
Source: HM Treasury Data Tables for Combined Expenditure, Country and Regional Public Sector Finances (authors’ analysis)
Thirdly, greater concentration of GFCF in capital city regions may not be solely a UK phenomenon, with many European countries seeing a reinforcement of a core-periphery model of economic development (Bachtler and Begg, 2018), although as the authors acknowledge this is a complex model with national variations (ibid., 153).
The impact of recent shocks
Research by the Bank of England (Anayi et al., 2021; Bloom et al., 2019) points to the recent adverse effects of the UK’s exit from the European Union and the COVID-19 pandemic. Both events have combined with other global difficulties around energy and the cost of living to increase uncertainty which raise further concerns around capital investment, especially the business investment component which nearly always tracks overall business confidence. Whilst the impact of COVID-19 is a symmetrical shock on economic performance (all industrialised economies would be impacted to a similar extent), Brexit is largely an asymmetrical shock, with the UK guaranteed to be worst hit (Tetlow and Stojanovic, 2018).
Moreover, Brexit, COVID-19 and the ‘cost of living’ crisis are likely to have differing spatial impacts. Initial analyses have suggested that London may be particularly hard hit due to the movement of finance companies to the EU and with the increasing ability for office workers to be mobile perhaps prompting them to move to lower cost parts of the country. Both would reduce demand for existing and new property in the capital. In turn, the rise of mobile working may also lead to a release of pressure in the London and greater South East property market. There is considerable uncertainty, however, and it is by no means a given that the demise of ‘Fortress London’ (Bright, 2022) will become a dominant force in the spatial economic development of the UK.
One possible implication for the levelling up agenda is that these three shocks may set in train forces which further weaken investment in poorer regions. One reason for this would be that yields from all investments across the UK fall, making investment in London and the South East more viable relative to the weaker regions. Similar processes have been found in the past where investors focus on yield volume (higher in London-based major property developments) than the percentage return (Guy and Henneberry, 2000). Whilst the LUWP points to the importance of physical capital it neglects very strong inherent tendencies in investment markets against decentralisation and levelling up.
Flaws in the LUWP
The LUWP is right to highlight physical capital as an important aspect of levelling up within its capitals framework. Most econometric analyses would highlight that, whilst it plays a role in explaining economic growth, it works within an interplay of different factors. It is not simply the amount of GFCF but how it is used, and as such this depends on a range of other factors which explain productive investment, such as the role of institutions, of other markets (such as credit), human capital and skills, and other resources. Moreover, because it inevitably has a physical manifestation, much of which is visible, it also helps to shape external perceptions of different places as well as presenting benefits to potential investors. However, the LUWP makes little of this link in its emphasis on ‘place-making’, focusing instead on grant-driven improvement in a limited number of places. That said, including it as one of a number of different intersecting ‘capitals’ and also as a focus for one of its missions is at least a ‘first step’ recognition of its importance.
Nevertheless, what is concerning is that the LUWP fails to grasp that regional differences in physical capital investment are deep seated and that changing course may require a more fundamental consideration of the workings of the UK economy and its approach to corporate governance. Research on financialisation of the economy (the growing significance of finance in all aspects of economic life) highlights two concerning trends, neither of which is tackled in the LUWP. The first is around the significance of financial services as a focal point for investment (in particular FDI), but also in terms of the public investment required to support this model of growth (for instance investment in transport infrastructure in London). Such public investment serves to ‘crowd in’ rather than ‘crowd out’ investment, although the latter is often the received wisdom of followers of ‘trickle down’ regeneration (Bachtler and Begg, 2018; Coyle and Sensier, 2020). The second, and something which Tori and Onaran (2018) point to, is that even in non-finance companies (NFCs) the significance of financial activities is growing as a part of the companies’ profitability (a simple example would be of car companies selling car finance services and these contributing more to profits that the sale of the vehicle itself) (do Carmo et al., 2019). The outcome of this is that manufacturing firms are seeking greater returns from financial services and less from physical production, meaning investment in physical capital is de-prioritised. The LUWP’s response is to suggest voluntary measures around some institutional pension schemes being used for local purposes, for example by issuing a proportion of their capital in the form of local bonds. These approaches alone seem insufficient, not least because the LUWP does not mandate any change of course from the status quo.
Whilst the LUWP focuses much attention on high value added and knowledge intensive sectors, it says little about what might be done around low value added and less sustainable sectors. This is a challenge, not least because it is the latter which have been key sources of employment in many former industrial heartland regions. The LUWP has missed a great opportunity to think through how some of the most significant challenges of the future can be met.
Conclusion: the LUWP – unfit for the scale of the challenge
The LUWP has been a long-heralded policy of Boris Johnson’s government. Prior to its appearance a slew of other policy initiatives had been launched with the aim of addressing not only the UK’s overall underperformance in terms of physical capital investment, but also the weakness of many UK regions relative to London and the South East. Two key aspects of this are the National Infrastructure Strategy and the post-COVID economic plan Build Back Better. Like the LUWP both signal the need for greater physical capital investment. For example, the review of the National Infrastructure Strategy by the National Infrastructure Commission (NIC) highlights that UK infrastructure expenditure per annum has been slowly increasing during the 2010s to around £22 billion in 2021/22 (NIC, 2022: 5). However, the government’s target for infrastructure spending for the 2022/23 to 2024/25 period is £32 billion per annum, significantly above the UK’s recent average. As the NIC goes on to highlight, across a host of areas (digital, energy, flood alleviation, water, waste, and transport) the challenges are as much in planning and delivery as they are with funding (ibid., 8). The capacity to absorb funding at this rate, and to secure good value, is significantly challenging at a national level and not just within disadvantaged regions. It highlights that the problems of physical capital investment need to be understood simultaneously at local/regional, national, and ultimately at international scales, given the role of global circuits of capital in driving investment.
A key response of the government has been the establishment of the UK Infrastructure Bank (UKIB). UKIB is based in Leeds and was capitalised with £12 billion of HM Treasury funding in a combination of equity and debit finance. It is essentially an ‘arms-length’ investment body of the Treasury. It is intended to provide capital alongside the private sector to bring forward and successfully deliver major infrastructure projects. This is part of the government’s argument that the UKIB will ‘crowd in’ private sector investment.
Unfortunately, the LUWP and its approach to capital investment is unfit to the challenge. Firstly, the UKIB in part replaces the Green Investment Bank scrapped by David Cameron’s government and the European Investment Bank which has invested €118 billion in UK infrastructure since 1973. Secondly, the scale of the funding is simply insufficient. Research by PwC (2020) has shown that just to meet the UK’s 2050 net zero commitment (now enshrined in legislation), the UK would need to invest around £40 billion a year for the next ten years for the country to have a realistic prospect of achieving this goal within the prescribed timeframe. UKIB falls short not just on this ambition, but on the others set for it such as levelling up.
Thirdly, its commitment to a deal-based approach has been questioned. Analysis for the Financial Times (Plimmer, 2022) shows that rather than making direct deals in investments as intended, the UKIB is investing in third party funds. Whilst this has merit in allowing the funding to go further, it cedes control over and potentially alters the focus of the funding which is available. And finally, the UK has one of the most privatised infrastructure systems in the world. Whilst the deal-based approach of the UKIB may provide needed capital, it risks repeating the problems of providing limited control by government over the assets produced by such investment in ‘public goods’ (Helm, 2009; Allen and Pryke, 2013).
Even if the funding was available for the challenges set by the LUWP, much of the thinking which underpins it reflects a traditional approach to physical capital investment. Beyond a steer to invest in zero carbon activities and high-speed digital connectivity, the manner and form of investment has not changed, with existing flaws in models of investment likely to be replicated in the future. Understanding the UK’s problem of limited investment in physical capital in poorer regions may start with understanding existing and historic flows of investments, but diagnosing the solutions to this requires a far deeper analysis of the problems of the model of UK capitalism, the rise of financial over non-financial interests, and the role of government in relation to global circuits of capital.
Against this backdrop, the LUWP is window dressing and not the revolution some herald it to be. Moreover, it is unclear whether it’s largely interventionist stance will survive the coming months under the new government led by Rishi Sunak. While the UK’s regional problem will not have disappeared, we await the shape of the next efforts to address it with much trepidation.
Professor Peter Wells, Sheffield Hallam University, Howard Street, Sheffield, S1 1WB. Email: p.wells@shu.ac.uk
Allen, J. and Pryke, M. (2013) Financialising household water: Thames Water, MEIF, and ‘ring-fenced’ politics. Cambridge Journal of Regions, Economy and Society, 6, 3, 419–439. CrossRef link
Anayi, L., Bloom, N., Bunn, P., Mizen, P., Oikonomou, M. and Thwaites, G. (2021) Influences on investment by UK businesses: evidence from the Decision Maker Panel. Bank of England Quarterly Bulletin, 2021 Q2. Available at: https://www.bankofengland.co.uk/quarterly-bulletin/2021/2021-q2/influences-on-investment-by-uk-businesses-evidence-from-the-decision-maker-panel [Accessed: 30/05/22]
Bachtler, J. and Begg, I. (2018) Beyond Brexit: Reshaping policies for regional development in Europe. Papers in Regional Science, 97, 151–170. CrossRef link
Blomström, M., Lipsey, R.E. and Zejan, M. (1996) Is fixed investment the key to economic growth? The Quarterly Journal of Economics, 111, 1, 269-276. CrossRef link
Bloom, N., Bunn. P., Chen, S., Mizen, P. and Smietanka, P. (2019) The Impact of Brexit on UK Firms. Nber Working Papers (n. 26218). CrossRef link
Bright, S. (2022) Fortress London: Why we need to save the country from its capital. Manchester: HarperNorth.
Coyle, D. and Sensier, M. (2020) The imperial treasury: appraisal methodology and regional economic performance in the UK. Regional Studies, 54, 3, 283-295. CrossRef link
Coyle, D., Zenghelis, D., Agarwala, M., Felici, M., Lu, S. and Wdowin, J. (2019) Measuring wealth, delivering prosperity. Available at: https://www.bennettinstitute.cam. ac.uk/wp-content/uploads/2020/12/WER_layout_online_July_2019_final_doubles.pdf [Accessed : 13/07/2022]
Dasgupta, P. (2021) The Economics of Biodiversity: The Dasgupta Review. London: HM Treasury. CrossRef link
De Long, J. and Summers, L. (1991) Equipment Investment and Economic Growth. The Quarterly Journal of Economics, 106, 2, 445-502. CrossRef link
do Carmo, M., Sacomano Neto, M. and Cesar Donadone, J. (2019) Financialization in the Automotive Industry: Shareholders, Managers, and Salaries. Journal of Economic Issues, 53, 3, 841-862. CrossRef link
Gardiner, B., Fingleton, B., and Martin, R. (2020) Regional Disparities in Labour Productivity and the Role of Capital Stock. National Institute Economic Review, 253, R29–R43. CrossRef link
Gardiner, B., Fingleton, B., Martin, R. and Barberi, L. (2021) UK Regional Capital Shocks and Productivity, an Updated Analysis. Economic and Social Research Council. Available at: https://productivityinsightsnetwork.co.uk/app/uploads/2021/05/Regional-Capital-Stock-Report-final.pdf [Accessed: 30/05/2022]
Gray, M. and Barford, A. (2018) The depths of the cuts: the uneven geography of local government austerity. Cambridge Journal of Regions, Economy and Society, 11, 541–563. CrossRef link
Guy, S. and Henneberry J. (2000) Understanding Urban Development Processes: Integrating the Economic and the Social in Property Research. Urban Studies, 37, 13, 2399-2416. CrossRef link
Haldane, A. (2017) Productivity Puzzles. Speech at the London School of Economics. Available at: https://www.bis.org/review/r170322b.pdf [Accessed: 17/06/2022]
Hassink, R., Isaksen, A. and Trippl, M. (2019) Towards a comprehensive understanding of new regional industrial path development. Regional Studies, 53, 11, 1636-1645. CrossRef link
Helm, D. (2009) Infrastructure investment, the cost of capital, and regulation: an assessment. Oxford Review of Economic Policy, 25, 3, 307–326. CrossRef link
HM Government (2022) Levelling Up: Levelling Up the United Kingdom. White Paper. CP 604. London: HMSO. Available at: https://assets.publishing.service.gov.uk/government/uploads/system/uploads/attachment_data/file/1052706/Levelling_Up_wp_ppp_HRES.pdf [Accessed: 30/05/2022]
HM Treasury (2022) The Green Book: Central Government Guidance on Appraisal and Evaluation. Available at: https://assets.publishing.service.gov.uk/government/uploads/system/uploads/
attachment_data/file/1063330/Green_Book_2022.pdf [Accessed: 27/10/2022].
Lipsey, R.E. and Kravis, I.B. (1987) The Competitiveness and Comparative Advantage of U.S. Multinationals, 1957-1984. Banca Nazionale del Lavoro Quarterly Review, 161 (June 1987), 147-165.
National Infrastructure Commission (NIC) (2022) Infrastructure Progress Review 2022: Annual Monitoring Report. Available at: https://nic.org.uk/app/uploads/NIC-Infrastructure-Progress-Review-2022-FINAL.pdf [Accessed: 20/06/2022]
Plimmer, G. (2022) UK Infrastructure Bank criticised for investing in third party funds. Financial Times, 29 May 2022. Available at: https://www.ft.com/content/dc489f21-a2d4-4188-8766-94c55d3e4c4f [Accessed: 20/06/2022]
PwC (2020) Unlocking capital for Net Zero infrastructure: Aligning policy and private capital to provide the infrastructure backbone to a Net Zero economy. Available at: https://www.pwc.co.uk/power-utilities/assets/documents/PwC%20-%20Unlocking%20Capital%20for%20Net%20Zero%20Infrastructure%20-%20Nov%202020.pdf [Accessed: 20/06/2022]
Rodríguez-Pose, A. and Ketterer, T. (2020) Institutional change and the development of lagging regions in Europe. Regional Studies, 54, 7, 974-986. CrossRef link
Tetlow, G. and Stojanovic, A. (2018) Understanding the economic impact of Brexit. London: Institute for Government. Available at: https://www.instituteforgovernment.org.uk/sites/default/files/
publications/2018%20IfG%20%20Brexit%20impact%20[final%20for%20web].pdf [Accessed: 20/06/2022]
Tori, D. and Onaran, Ö. (2018) The effects of financialization on investment: evidence from firm-level data for the UK. Cambridge Journal of Economics, 42, 5, 1393–1416. CrossRef link
Van Ark, B., De Vries, K. and Erumban, A. (2021) How to not miss a productivity revival once again. National Institute Economic Review, 255, 9-24. CrossRef link