Abstract
Household energy poverty and transport energy poverty are increasingly recognised as entangled in energy social science. The intersection of these related phenomena is growing due to twin transitions of decarbonisation and digitalisation, whereby transport modes are increasingly electrified, and household electricity use is digitalised. Sectoral coupling enables energy flexibility, which is crucial for enabling greater renewable energy penetration in the electricity mix to advance decarbonisation agendas. Yet there are potential negative outcomes of this cross-sectoral hyper-integration, in terms of exacerbating existing inequalities and creating new ones. Digitalised systems can exclude marginalised groups, constitute intrusion on privacy, reallocate resources such as public space and electricity to certain transport modes at the expense of others, and drive dynamic electricity tariffs that penalise those with inflexible usage patterns, who typically include energy-poorer households. This paper examines how these issues play out in the under-privileged neighbourhood Østre Bydel in affluent Stavanger, Norway – a city targeting low-carbon urban transport transitions where energy poverty is an under-studied concern. Based on 45 structured interviews with households in the neighbourhood conducted during autumn 2021 complemented by desk study, the paper analyses double energy vulnerability in the city’s systemic transition to low-carbon transport coterminous with rapidly digitalised electric infrastructure.
Introduction: Low-carbon transitions and energy poverty in Norway
On 4 September 2021, the Norwegian broadcasting corporation NRK published a feature entitled ‘Electric shock’ (Thunold, 2021). With national elections due to be completed on 13 September 2021, the timing of this feature was hardly surprising to close observers of political coverage by mainstream media. To the extent that energy poverty features in public debate in Norway, it focuses on the energy vulnerable as a marginal category during politically crucial junctures such as election run-ups; the general discourse is that Norway is a rich, energy abundant country, as Bredvold (2020) has elaborated. Yet while the timing was expected, the content was no fringe phenomenon. Narratively focused on the sky-high electricity bills of students in shared housing during the cold and dry winter of 2020, the feature reported deeply concerning figures. Based on figures from only the three largest energy suppliers who service 1.3 million households, Thunold (2021) reports that 3,700 households have had their electricity cut off by August 2021 this year, which is 1,000 more than at the same point in 2018 and 2019, years with erstwhile record-high electricity tariffs, and 2.8 of every 1,000 households on average. No cumulative overview exists across the 130-plus energy suppliers in total that service about three million households in Norway.
Research has begun to identify some key factors behind such energy poverty, addressing which is key to achieving just transitions to sustainability that advance low-carbon energy futures in equitable ways (Newell and Mulvaney, 2013; Kelly et al., 2020). Fjellså et al (2021) analyse students’ everyday energy practices to argue that the increasing electrification across sectors in Norway and the advent of dynamic electricity tariffs is liable to place those with relatively inflexible energy needs and low household budgets in vulnerable positions due to “flexibility poverty” in electricity usage, i.e., an inability to exercise flexibility in their electricity practices which exposes them to harm such as high electricity bills. Sareen (2020) points out the scalar biases in the rollout of smart electric meters in Norway whereby control of energy flexibility is held by supply-side actors whereas responsibility is shifted on to households. These trends gain significance when one considers that on 12 February 2021, electricity demand in Norway during a morning peak hour hit a record high of 25,230 MWh (Thunold, 2021). A highly electrified country, where most space heating and cooling, cooking and lighting is electrically powered and hitherto largely sourced from hydropower with a small but increasing wind power component, is in the process of ramping up electricity use in sectors such as transport, construction and heavy industry. Most notably, Norway is at the forefront of a global revolution in electric car adoption, which its car-reliant upper middle and middle class households have actively embraced thanks to an all-inclusive incentive package (Fevang et al., 2021).
These developments present the risk of a dual class society, where the privileged enjoy the benefits of a low-carbon energy transitions as smart energy prosumers who can combine electric cars, photovoltaic panels and smart electricity devices to automate an optimal relationship between energy usage and dynamic tariffs (Korsnes and Throndsen, 2021). Meanwhile, the ‘flexibility poor’ may face greater risk, as pointed out by Ryghaug et al. (2018: 298) who reflect upon “the limits of a materialized energy citizenship, especially in the risk that it creates inclusion of the already advantaged, those with purchasing power and means to acquire new technologies, while excluding others”. In particular, the high electricity prices throughout Europe during summer 2021 – including in Norway where 2021 has been relatively dry and has depleted hydropower reserves thus pushing up electricity tariffs – raise concerns of energy poverty that may well be exacerbated if further digitalisation takes place without adequate attention to social inclusion and equity. Importantly, such attention must span multiple sectors that are increasingly electrified. In Norway, this applies to domestic energy use and the transport sector, where in addition to electric cars, public transport fleets of buses and ferries are turning electric, alongside existing and expanding light rail and subway systems.
Recent headway has been made on double energy vulnerability (DEV), which addresses the intersection of domestic energy poverty (DEP) and transport energy poverty (TEP) (Robinson and Mattioli, 2020). Martiskainen et al. (2021) further link DEV to low-carbon transitions. In this article, we operationalise DEV at the sub-urban scale in a Norwegian setting. Our empirical focus is on Norway’s energy capital of Stavanger on its southwest coast, a relatively affluent city with a history of offshore oil and gas production over the past half century. Within Stavanger, we direct attention to the historically poorer neighbourhood Østre Bydel (literally the ‘Eastern suburb’), long inhabited by the working class, with an infrastructural legacy of old wooden houses from the 19th and 20th centuries (Bang-Andersen, 1985; Nerlie, 2011).
In this sub-urban setting, we explore the incidence of DEV through a questionnaire survey. Based on 45 responses, we offer a first-of-its-kind baseline analysis at the sub-urban scale in Norway. Our intent is to understand how DEV manifests in a Norwegian city, by addressing two questions: (i) Who experiences DEV in what ways; and (ii) How the incidence of DEP and TEP relate to each other. Our empirical analysis constitutes a basis to discuss how we can measure DEV, providing a timely research-based input to policymakers after the national election of 2021. We relate our insights to the Action Plan 2018-2022 on transport within the Climate and Environmental Plan 2018-2030 for Stavanger municipality. We further reflect on the import of our case study in a Norwegian urban context for emerging DEV research.
The article is structured as follows. The next section provides definitions and a brief theoretical overview of DEV research with an explicit focus at the sub-urban scale which is relatively unexplored in the evolving state-of-the-art. Subsequently, we describe our case study and offer methodological details, including an overview of our methods and materials. The fourth section presents our empirical analysis. This is followed by a concluding discussion that emphasises the significance of our study for policy to address DEV in Norwegian urban contexts and for DEV research more broadly.
Double energy vulnerability research and the sub-urban scale
Considerable literature on DEP has been produced in recent years, establishing its definition as “the inability to attain a socially and materially necessitated level of domestic energy services” (Bouzarovski and Petrova, 2015: 31). TEP is a more nascent term and focus in scholarship (Lowans et al., 2021), understood here in line with Martiskainen et al. (2021: 4) as “the inability to attain socially and materially necessitated levels of transport services”. We follow Robinson and Mattioli (2020: 1) who define DEV as “the increased likelihood of negative impacts upon well-being, owing to the intersection of domestic energy poverty (DEP) and transport energy poverty (TEP)”. This is in line with Mayer et al. (2014) who combine attention to domestic and transport energy demand and expenses and relate it to household income to study these two faces of energy poverty. Calls for a combined focus have now persisted for approximately a decade (Sovacool et al., 2012). They emphasise that domestic and mobility needs represent considerably different challenges for metricisation (Lowans et al., 2021), and within TEP distinguishing between the poverty of transport (limited, sub-standard options) and transport affordability (Mattioli et al., 2017).
Growing policy attention has led researchers to point out the limits of current knowledge on DEP, and this is likely to apply even more to TEP. Thomson et al (2017) emphasise the need to systematically collect data at the household scale, and reflect that existing databases largely capture consequences rather than causes of DEP; where they capture causes, the authors point out that these are tricky to identify correctly. Households often prioritise other essential purchases over addressing DEP which makes expenditure indicators of limited use, and everyday practices remain hard to capture. Tirado Herrero (2017) highlights ‘hidden’ energy poverty, wherein households that disconnect from electricity by themselves to avoid falling into debt are not reflected even in nuanced and disaggregated indicators such as considering households in arrears on their electricity bills or that have been disconnected from the grid by suppliers due to accumulated debt. One way to address these shortcomings is to conduct empirical work at the sub-urban scale for greater granularity. Sánchez et al. (2020) conduct a combined urban and district scale study where they demonstrate the value of small-scale insight on DEP and income poverty in Madrid. Urban and sub-urban scale analyses as in a study based on household surveys in Beijing (Robinson et al., 2018) and novel approaches that combine spatial mapping at high resolution with household interviews in Portugal (Horta et al., 2019) have begun to emerge. Yet considerable work remains to be done on DEP at the sub-urban scale.
This holds even truer of TEP. In particular, as Martiskainen et al. (2021) point out, low-carbon energy transitions in multiple sectors including transport are bound to impact TEP in ways that require urgent understanding to safeguard against adverse impacts for vulnerable households. In their longitudinal analysis of Toronto, Allen and Farber (2020) show how unpacking transport trends at the sub-urban scale can reveal patterns of sociospatial inequity and concentration of vulnerability. With a focus on Oslo, Fearnley and Aarhaug (2019) differentiate the distributional impacts of transport subsidies at the sub-urban scale. Clearly, there is variation in how TEP expresses itself within a city. Yet its co-incidence with DEP remains remarkably under-studied, with a systematic review of DEP and TEP (Lowans et al., 2021) indicating that combined (but not composite) indices are required, and pointing out that defining ‘necessary travel’ is inherently difficult and therefore requires an understanding of vulnerability. Correspondingly, our ambition in this article is to extend the basis to enable holistic assessment of DEP and TEP at the sub-urban scale, where a situated understanding of vulnerability is possible to determine through triangulation with existing knowledge on living standards at the sub-urban scale, combined with relatively simple demographic and socio-economic indicators through a small-scale survey of households.
Such a focus on the identification and situated analysis of vulnerability is at the heart of the challenge that Robinson and Mattioli (2020) provide the means to address. They identify the neighbourhoods where households in England have an increased likelihood of negative impacts upon well-being due to intersecting DEP and TEP, that is, high exposure to double energy vulnerability. We take a neighbourhood with the potential for similar proclivities in Norway, and through a closer look at multiple variables of DEP and TEP for 45 households, reflect upon whether they are in DEV. Our analysis aims to advance current understanding of DEV at the sub-urban scale for deeper appreciation of the ways in which DEV manifests and the relationship between DEP and TEP.
Case background, methodology, methods and materials
Case selection: Stavanger and Østre Bydel
The coastal city of Stavanger has been the high seat of the Norwegian petroleum industry for the past half century, a legacy that has made the city and its adjacent municipalities among the most affluent in Norway in terms of median income per household (Statistics Norway, 2020). Despite Stavanger’s relative affluence, the municipality has one of the highest levels of income inequality in Norway (Tuv, 2019). This local wealth disparity carries interesting implications for what it means to be poor in a wealthy city, constituting a suitable setting for our study of DEV. Correspondingly, our research strategy was to identify a sub-urban neighbourhood in Stavanger that is more likely to be prone to energy poverty, broadly construed.
According to official local statistics, the neighbourhood of Østre Bydel – located directly east of the city centre – has the lowest median income and rate of education in Stavanger, the highest rate of increase in child population and highest incidence of child poverty, and the greatest unemployment rate (Stavanger Municipality, 2019). Livelihoods in Østre Bydel were hit particularly hard by the 2014 oil crisis, and subsequent years marked a steep rise in unemployment – more so in Østre Bydel than other parts of the city (ibid.). The Stavanger Municipality’s Living Conditions Report shows that socio-economic indicators such as child poverty have continued to rise since then (Stavanger Municipality, 2019). Moreover, the history of this neighbourhood has significant impact on the building stock, which remains historic and was not upgraded in the post-oil discovery boom years of the 1970s unlike other parts of Stavanger, with an exodus to new-builds in the suburbs, and consequent conversion of Østre Bydel’s two-family houses into single-family houses due to low occupancy rates in old buildings (Bang-Andersen, 1985; Nerlie, 2011). More recently, new buildings have come up with rapid gentrification along the waterfront (Benhabiles and Bjørnstad, 2017). This is likely to make for considerable variation at the sub-urban scale as well.
Study scope and existing DEP and TEP support in Norway
Limiting our research to an area of relative socio-economic vulnerability provided both spatial and demographic demarcation as well as limiting the scope of the study. Thus, we are able to focus on an area where several groups at risk of both DEP and TEP – such as lower income households, families with children and people with health difficulties (Martiskainen et al., 2021) – can potentially be identified (Stavanger Municipality, 2019). Scope is further limited to people’s self-reported experiences of and variables related to DEP and TEP, as we collected primary data through randomly sampled survey respondents within the neighbourhood complemented by desk-based study of municipal sources, without in-depth methods such as participant observation.
Based on statistics from the Living Conditions Report that shows a relatively high rate of unemployment benefits claimed from the Norwegian Labour and Welfare Administration (NAV) in Østre Bydel, we anticipated that the neighbourhood would include households that receive energy and transport related financial support (Stavanger Municipality, 2019; NAV, 2021). Such schemes include the state-backed allowance for households with low income and high housing expenses (Husbanken, 2021), and subsidies through the government enterprise Enova in the form of financial support for energy efficiency upgrades to housing (Enova, 2021). The latter has, however, been criticised for being socially regressive and biased towards more affluent households (Bredvold, 2020). As Ryghaug et al. (2018) argue, engagement with new low-carbon energy technology is key to enable energy end-users to become active participants in creating sustainable practices, whereas the inclusion of vulnerable households beyond those with purchasing power requires nuanced targeting strategies.
Methodology, methods and material
The study was conducted during August-September 2021 by a five-person team. We designed a questionnaire based on state-of-the-art research on DEV (most notably Robinson and Mattioli, 2020) and customised it to the context of Stavanger and Østre Bydel. Some existing work on energy poverty and practices in urban Norwegian contexts was useful in this regard (Fjellså et al., 2021; Bredvold, 2020; Winther and de Lesdain, 2013; Westskog et al., 2015), in addition to awareness of local media coverage and lived experience of the study context amongst team members. The questionnaire was trialled within the team and refined based on internal reflection. We added a map of Østre Bydel, and provided to respondents along with a copy of the questionnaire and an overview of the study, including information to contact the team later if they wished. The study was registered in an institutional directory in accordance with national ethics guidelines prior to commencing fieldwork.
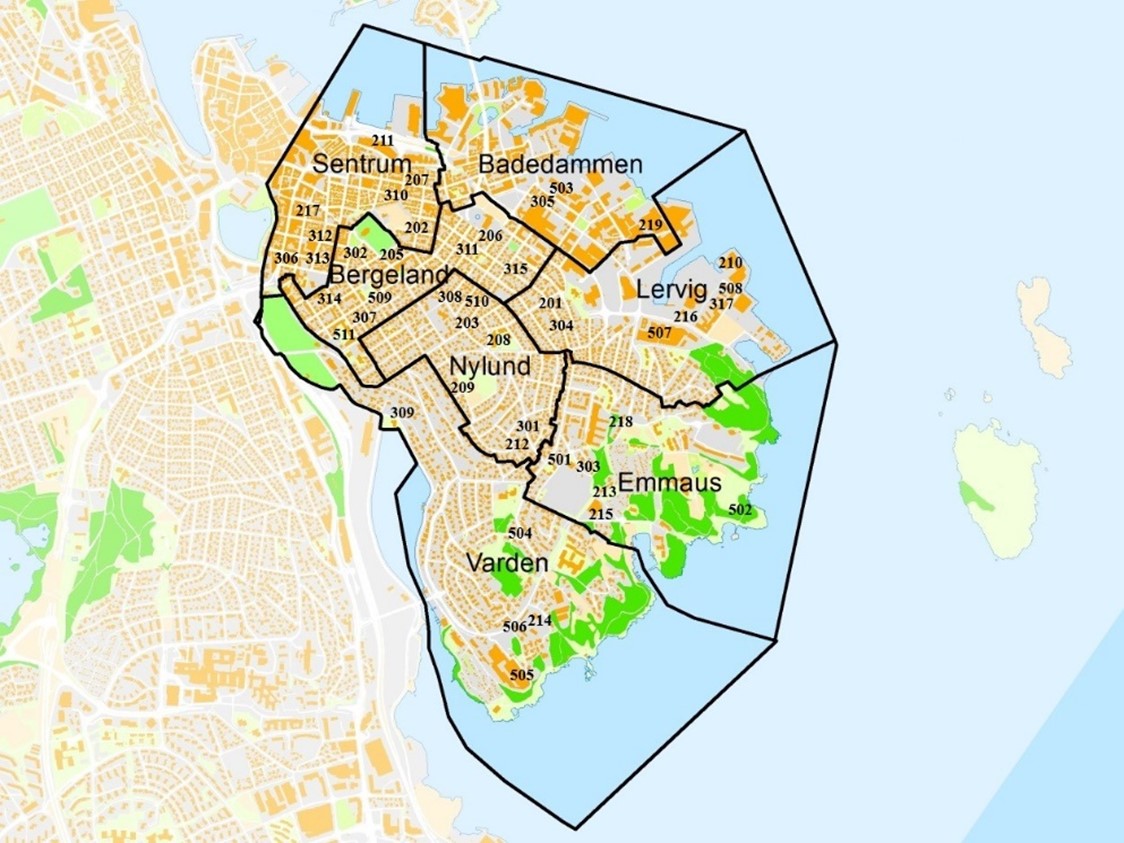
Fieldwork was carried out over a three-week period in late August and early September and involved 45 respondents in the demarcated area of Østre Bydel. Given funding and time limits, we struck a balance between modest quantitative coverage and the scope for deeper qualitative insights, notably by asking a greater number of questions, allowing respondents to expand on specific aspects of interest, and including crucial field considerations by having researchers administer surveys ourselves, thus prioritising exposure over sample size (also see Small, 2009). Team members approached respondents outdoors at various locations within Østre Bydel at different times of the day during both weekdays and weekends. People were generally more willing to participate during the weekends, as they were less fazed by the specified ten-minute timeframe of the questionnaire. Respondents were required to live within the demarcated area in order to participate, and their approximate residence location was marked on a master map, shown in Figure 1. The numbers on the map refer to the codes assigned to each respondent (example: interviewer two coded their respondents starting with 200, while interviewer three coded starting from 300). As evident, the study achieved considerable breadth in the spatial distribution of Østre Bydel residents.
Figure 1: Approximate residence locations of respondents within Østre Bydel
The questionnaire featured 34 questions, divided into two main categories: DEP and TEP. Each section was further bifurcated to aim at four main lines of enquiry.
DEP1 focused on the demographic and socio-economic profile and status of the household and respondent, as appropriate across various heads related to age, employment, housing status and type, electricity supplier, income, electricity bill and rent. DEP2 focused on domestic energy practices and experiences, including space heating, the use of smart home devices, respondents’ awareness of and opinion about electricity tariffs and fluctuations, knowledge about electricity subsidies and related topics.
TEP1 focused on respondents’ transport profile and status, covering aspects such as car ownership, access to vehicle types, access to public transport, and costs related to modal choices. TEP2 focused on their transport practices and experiences, such as the frequency of use of various transport modes, and preferences and constraints related to various types of trips and needs. We also asked about perceptions of energy policy.
The questionnaire was written in both English and Norwegian, and interviews were conducted in whichever language the respondent preferred, which was typically Norwegian. A printed copy was shared with respondents if they agreed to be interviewed by team members. We approached respondents at random in the streets and parks of Østre Bydel, and continued until we achieved moderate spatial and demographic breadth of coverage and had collected adequate data for some depth of coverage on DEV within the limited study duration. The team conducted a preliminary analysis after collecting 19 responses, discussed emerging findings and decided to continue data collection. We conducted a detailed analysis of the whole dataset of 45 survey responses, and have made the raw dataset available along with this article as supplementary material for future use. Each team member analysed the findings independently, wrote and discussed specific aspects with the whole team, after which we worked to achieve consensus on an optimal structure. This is presented below in the empirical analysis, and balances thematic coverage with narrative clarity.
In sum, our methodology is adequate for an exploratory study rather than a comprehensive explanatory analysis, and aims to shed light on potential DEP and TEP indicators that suggest incidence of DEV. By pointing out potential relationships between DEP and TEP in a relatively socio-economically vulnerable area, we contribute to the development of qualitative DEV research (Robinson and Mattioli, 2020), whose study in Norway has been very limited to date.
Double energy vulnerability in Stavanger’s Østre Bydel
We report four main results in the empirical analysis below. The first offers insights into the cross-section of multiple variables of interest for DEP. The second provides summary statistics on TEP from our limited sample and considers the incidence of DEV. The third offers a closer look at two respondent categories with potentially higher propensity for DEV, namely the unemployed and pensioners. A fourth result relates to how perceptions of energy policy in Norway vary by respondent age group. These results mark a preliminary foray into DEV at the sub-urban scale in Norway.
Cross-section of multiple variables of interest for DEP
To understand a phenomenon as complex as DEV and identify which households are affected and in what ways, it is necessary to develop ways to detect and measure DEV.
Here, we examine variables of interest for DEP. One widely used indicator of DEP is the so-called 10 per cent indicator, which defines energy poor households as those who spend more than 10 per cent of their income on energy (Robinson and Mattioli, 2020). The indicator originated in the UK, and has since been adopted in both European and non-European contexts, despite different contextual needs (Sareen et al., 2020). However, recently it has become widely accepted that energy poverty should be measured using a combination of diverse indicators (EU Energy Poverty Observatory, 2021). We hold that subjective accounts, domestic energy practices and lived experiences can be at least as valuable for measuring DEP as numbers and indicators, since they allow unravelling dimensions of energy poverty that remain hidden in quantitative data. To balance coverage of a range of contextually relevant variables with a brief questionnaire for short response time, we captured data on household demographics, income, electricity usage and related practices (this being the main domestic energy source in Stavanger), heating practices, access to energy subsidies and awareness related to energy usage. Rather than tightly corresponding to a particular set of indicators prevalent elsewhere in Europe (cf. Thomson et al., 2017) but not yet defined in Norway, we aimed broadly for relevance to socio-spatial context (Robinson et al., 2019).
In our dataset of 45 households, our analysis of aggregate characteristics categorised five respondents as vulnerable to DEP, a rate of 11 per cent (Table 1). It is evident that these respondent households share certain similarities. For instance, the majority of them: belong to the older generation, and/or are unemployed, and/or have low income, and/or rent rather than own their relatively small residencies, and/or adopt domestic energy practices that allow them to save electricity costs. Three of these five respondents had received subsidies for their electricity bills from NAV, whilst one respondent had applied for but not received the subsidy. Among these households, only one reported an electricity bill exceeding 10 per cent of their monthly income, three estimated 10 per cent, and one estimated this to be in the 6-10 per cent range. While estimates, these self-perceptions show that energy poverty as a phenomenon spans a breadth that transcends definition and categorisation with a single number.
Table 1: A closer look at DEP households identified in Østre Bydel
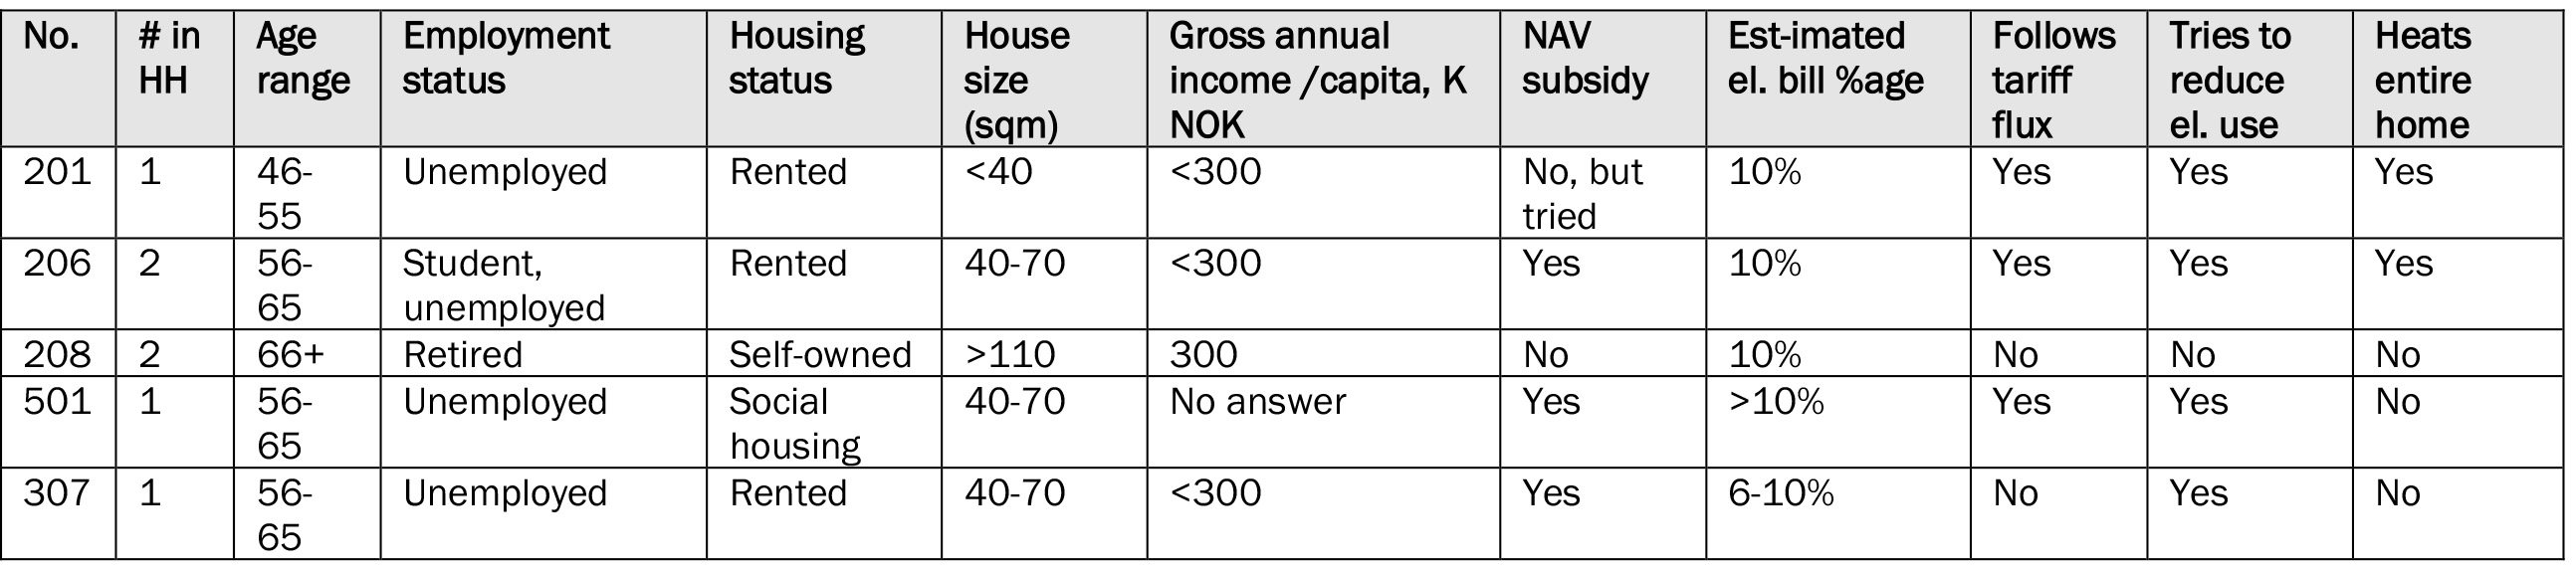
Respondent 208 was distinct in multiple respects: he was retired, owned his relatively spacious house, had never received NAV subsidies and was not trying to reduce his electricity bills. It can thus be argued that he is not in DEP. However, going beyond short answers and diving into the reasoning that underlies his responses, a different picture unfolds. Despite stating that he does not try to reduce household energy use, he explained that he does not heat the whole house because he does not want to waste heat every time he opens the door to walk his dog. When asked why he does not follow energy prices fluctuations, he stated that there is “no point in doing that, you need to pay anyway”, reflecting a low sense of agency related to controlling electricity expenses. This information, combined with data about the estimated annual electricity bill, which at 30,000 NOK was among the highest among all 45 respondents, and given relatively low household income (below 300,000 NOK gross per capita), suggests that this is an instance of hidden DEP (Sareen et al., 2020; Tirado Herrero, 2017).
Thus, our findings illustrate the difficulty of detecting DEP, especially in contexts like Norway where existing data and policy attention are inadequate (Ryghaug et al., 2018; Sareen, 2020). We argue that policymakers need to take both demographic and socioeconomic profiles as well as domestic energy practices and lived experiences into consideration in order to develop appropriate policy interventions for DEP alleviation.
The next sub-section examines variables related to the second dimension of DEV, namely TEP, and unpacks the challenge of detecting and metricising TEP.
Summary statistics on TEP and incidence of DEV
TEP is a wide-ranging phenomenon where several factors can affect the issue such as income, transport accessibility, and transport costs (Robinson and Mattioli, 2020). Here, we analyse the possible incidence of TEP. We then combine this with the findings on DEP to consider the identification of DEV.
Table 2 compares household income with car ownership. Despite the limited sample size, some trends in car ownership and type are evident across income groups. The most striking finding is a distinct difference in car ownership between the lowest income group (17 per cent) and the three other income groups. People with low income are generally considered to be at risk of TEP and DEP (Martiskainen et al., 2021), and our finding suggests that this may correlate with car ownership in the study context.
Table 2: Cross-section of household income and car ownership (% and number)
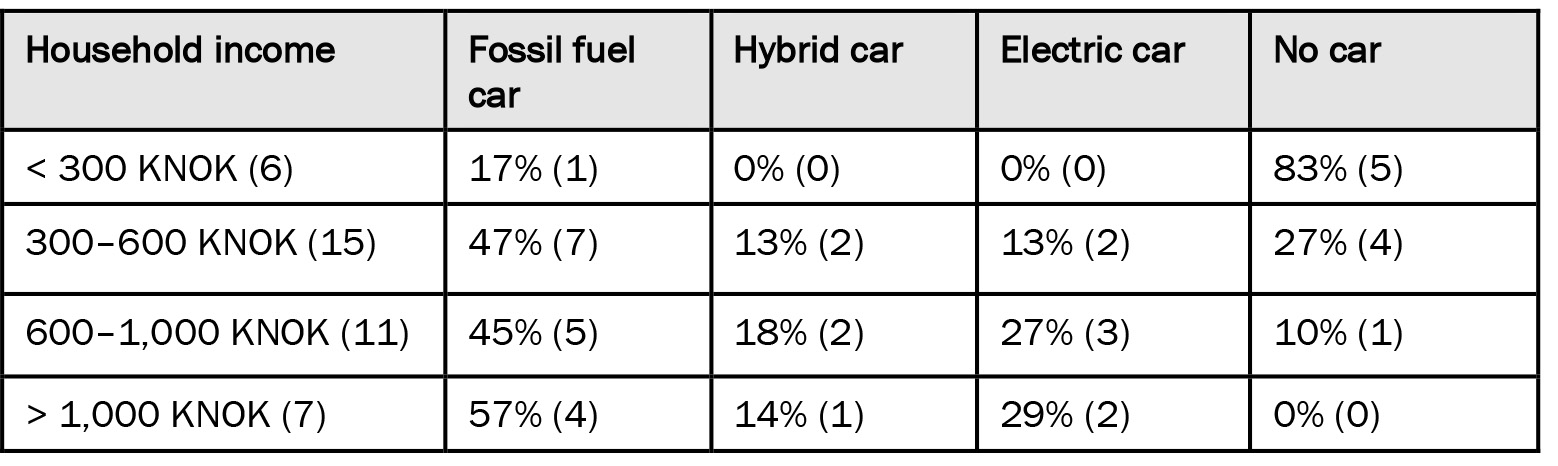
Note: Six of 45 respondents chose not to answer the household income question.
We gathered data on aspects such as monthly car expenditure, public transport use, and modal choices to reach the city centre. Estimated monthly expenditure corresponded closely with car type. Among fossil fuel car owners, it ranged from 500 to 5,000 NOK per month. For electric car owners, the cost was 200-300 NOK. This is in line with electric cars being given generous incentive packages in Norway, but considered alongside correpondence between income and car type trends, implies that those with lower disposable income in fact spend more on their cars. Moreover, cars appear to be desirable as transport modal choices, and the lowest income group is unable to own them relative to others, implying that they may be in hidden TEP. However, 27 per cent and 10 per cent incidence of no car ownership among mid-range income groups (4/15 and 1/11 households respectively) suggests some variation in prioritisation for factors besides income. Across respondents, public transport was commonly used, with 67 per cent (30/45 households) reporting weekly use. There was only one respondent who neither owned a car nor used public transport. To reach the city center, only four of 45 specified a response other than walking. The bicycle was also a popular choice for this type of trip, with 38 per cent (17/45 households) reporting usage.
Yet connecting this data to TEP remains difficult, given lacking standards to metricise TEP, and its context specificity and complexity. The 10 per cent threshold common in DEP research has also been employed in some TEP research (Lowans et al., 2021). However, without a more precise estimate of respondent income, and with only self-reported monthly car expenditure, meaningful comparison using this metric is not feasible. While precise income data is collected by the tax authority and could be suitably anonymised and systematically drawn on for this purpose in the future, accurate estimates of transport expenditure remain tricky to collect. Moreover, the 10 per cent metric has been criticised for not being able to distinguish those who are in TEP from those who are not (Lowans et al., 2021).
Despite these limitations, one can argue that two respondents are vulnerable to TEP, for distinct reasons. Both these respondents, 201 and 208, have been identified as being in DEP. Respondent 201 does not own a car and uses public transport more than five times a week. He reported cheating on the public transport system (ticketless travel), implying that he rarely or never pays for it. This is a difficult thing to admit face-to-face even in an anonymised interview, hence there is likely to be under-reporting across respondents. For 201, being in DEP could affect his choices regarding transport expenditure. Hence, we note a possible overlap of DEP and TEP, placing this respondent in DEV.
Respondent 208 owned a 23 year old fossil fuel car. Older cars are known to have possible efficiency and maintenance issues, and can be a factor for TEP (Martiskainen et al., 2021). The combination of an older car, high car expenditure and low income arguably places this person in a position of TEP and thus also DEV. While TEP and DEV are under-studied in Norway, these findings indicate that closer attention is warranted.
Stavanger municipality’s Action Plan 2018-2022 (under its Climate and Environmental Plan 2018-2030) lists no less than 62 measures to reduce the scope of transport and change travel habits, including 26 measures to achieve 70 per cent passenger transport by bicycling, walking and public transport by 2030 (Stavanger Municipality, 2018a). Yet these 26 measures are quite generic, and require adequate specification down to neighbourhood scale to make a real difference in the transport options and experiences of urban residents. A focus on vulnerability to TEP can inform this process.
Closer look at users with higher DEV propensity
In their study of England, Robinson and Mattioli (2020) employ the 10 per cent indicator and the Low-Income High Cost (LIHC) indicator to detect DEP households. While the former places households that spend over 10 per cent of income on energy in DEP, the latter places those with above-average energy costs and below-average incomes in DEP. To detect TEP, the authors employ a composite indicator to assess patterns of vulnerability to motor fuel prices increases. This captures a combination of high expenditure on motor fuel relative to income (i.e., high exposure), low income (i.e., high sensitivity), and high car dependence due to the inability to access essential services using alternative transport modes (i.e., lack of adaptive capacity) to identify households in TEP. Table 3 reports on versions of these variable for unemployed and retired respondents, based on the hypothesis that these are more likely to be vulnerable.
Table 3: DEV analysis for unemployed or retired respondents
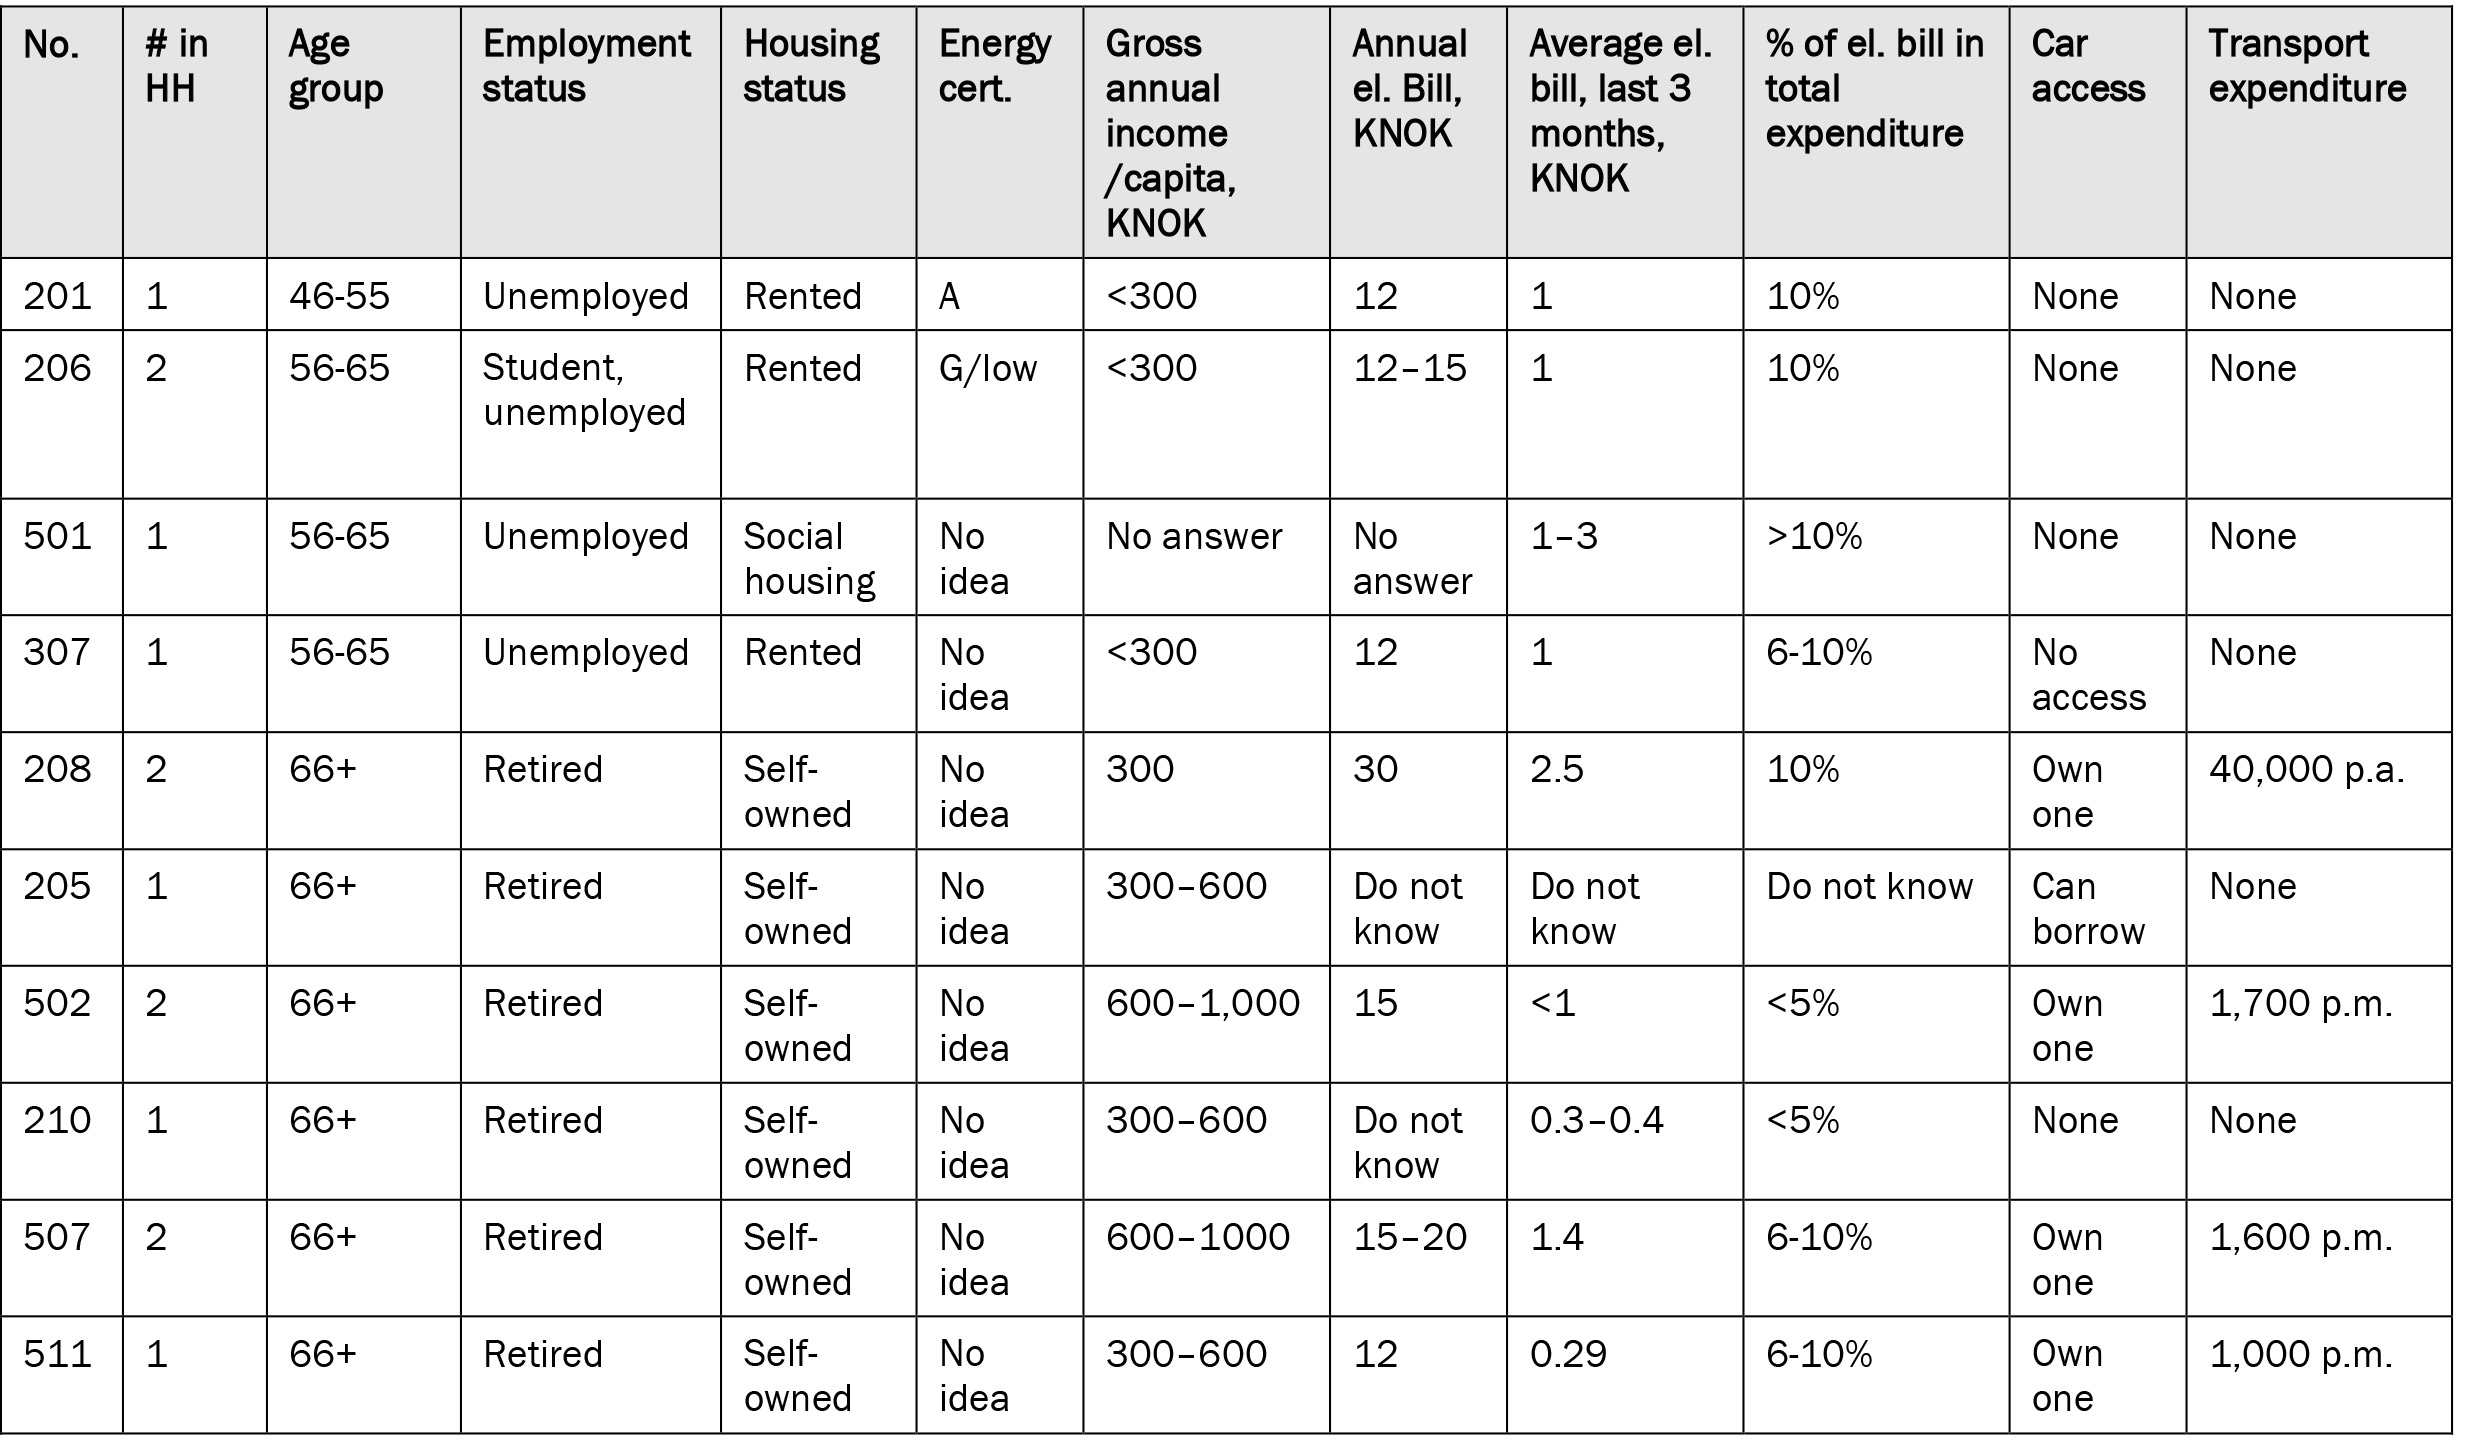
Table 3 shows that all unemployed respondents spend more than 10 per cent of their income on electricity bills, with a gross annual income below 300,000 NOK. Respondent 501 did not self-report income but did state that he uses over 10 per cent of household expenditure on electricity bills. Thus, unemployed respondents appear to be at clear risk of DEP. None of them report transport expenditure, which reflects no need to commute, but also suggests hidden TEP as this lack of expenditure may imply limited ability to afford transport, e.g. for leisure purposes.
Energy poverty appeared to be less prevalent among retired respondents. Robinson and Mattioli (2020) state that the 10 per cent indicator tends to point to pensionists as vulnerable to DEP. In our dataset, all retired respondents owned their homes, and five out of six had a mid- to high-range annual income, with only one reporting an income at the cusp of lower categories, 300,000 NOK. Electricity expenditure constituted below five per cent of household expenditure for two of these respondents, 6-10 per cent for another two, and one was unable to estimate a range. One retired respondent, 208, was potentially in DEV. He reported spending 10 per cent of his annual income of 300,000 NOK on electricity bills, and 40,000 NOK on car-related expenses. Thus, while the relatively high home ownership rate in Norway might imply that retired people are at lower risk of DEV than elsewhere, its incidence is nonetheless possible even for pensionists who own a home.
Interestingly, almost none of these respondents, either unemployed or retired, with potentially high sensitivity to energy expenditure, knew their home energy certificate rating.
Going beyond Table 3, an interesting trend related to another category of respondents with potentially high propensity for DEV, namely students. Most student respondents reported that their electricity bill was included in their rent, and thus had no idea of their electricity expenditure. This may be explained by an incentive for landlords to pay these expenses and include them as tax deductibles on their property leasing income. All interviewed students had monthly transport passes and used public transport more than five times a week, benefitting from subsidised student prices. This suggests that the regional transport operator Kolumbus’ scheme helps students avoid TEP.
Desired energy policy change across respondent age groups
Finally, we reflect upon the significance of our findings related to DEP, TEP and their intersection in terms of the incidence of DEV in Norway, and implications for monitoring it at the sub-urban scale.
Electricity prices in Norway in the second quarter of 2021 were 241 per cent higher than in the same period of 2020 (Statistisk Sentralbyrå, 2021). Even though this increase is primarily explained by weather conditions (a cold, dry winter in 2020) and European electricity prices, electrification of additional sectors like transport with further integration of renewable energy sources and transnational interconnections will impact Norwegian households in years to come.
Energy expenditure can be reduced by improving building energy efficiency, using smart home devices to optimise energy use, and replacing fossil fuel cars with electric cars or public transport. However, the vast majority of respondents did not know their home energy certificate rating (78 per cent, 35/45 respondents) and did not use any smart home devices (84 per cent, 38/45 respondents). The most common smart device named by (only three) respondents was a thermostat.
Four respondents mentioned energy efficiency home improvements: installing a heat pump and upgrading windows. However, such upgrades are hard to afford for low-income households most exposed to DEV. While Enova offers subsidies to incentivise home energy efficiency investment (Enova, 2021), no respondent had accessed such subsidies, and most were unaware they exist.
Four households owned an electric car, three a hybrid one, while 17 (i.e. 38 per cent) had one or more fossil fuel cars. Three respondents stated a need for better electric car charging infrastructure; two of them stated they would switch to an electric car given easier and cheaper charging options. This resistance despite Norway having the world’s most advanced electric car rollout and charging infrastructure (Funke et al., 2019) indicates the challenging nature of this transport transition and related public perceptions.
Changing energy policies is a more comprehensive way to impact electricity prices. We therefore asked respondents: “Are there any changes in energy policy you would like to see from the government?” The question was especially timely and relevant since we collected data just prior to national elections. One might expect households with relatively high energy expenditure to be concerned about rising electricity prices. However, only nine of 45 respondents (i.e., 20 per cent) explicitly mentioned reducing electricity prices, and of these nine, our analysis above only categorised one respondent as energy poor! This indicates the lack of a sense of agency in being able to change one’s predicament, at least among those other respondents who did appear to be vulnerable to DEP, and possibly a sense of apathy where others do not see it as a problem that impacts them much directly. By contrast, as electricity prices remained high and increased throughout autumn 2021, media coverage featured many calls for such reductions.
Table 4: Main desired changes in energy policy by respondent age groups (% and number)
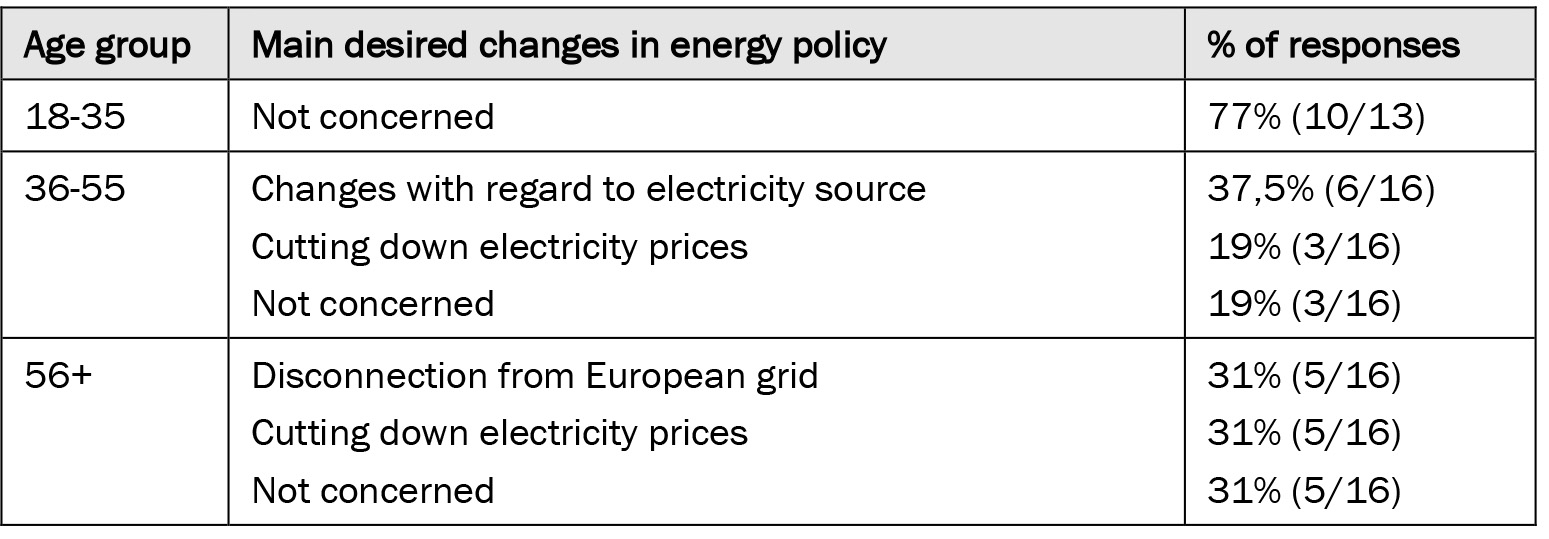
Results revealed a clear division between age groups (Table 4). Seventy-seven per cent of respondents aged 18-35 (10/13 respondents) suggested no energy policy changes. Most respondents aged 36-55 referred to changes in energy sources, such as stopping or continuing oil drilling, switching to renewable energy sources and developing nuclear power. Respondents aged over 55 mainly expressed concern over interconnections to the European electricity grid and rising electricity prices.
Considering the recent increase in electricity prices, proximity to national elections and a strong tradition of civic engagement, 38 per cent respondents (17/45 households) suggesting no changes to energy policy is surprising. However, Norway’s 2021 election witnessed among the lowest voter turnouts since the Second World War (Beckhaug, 2021), which may indicate a trend of lower engagement.
Discussion: Significance of findings for Norwegian cities and DEV research
In closing, we discuss key insights on who experiences DEV and how, and on how the incidence of DEP and TEP interrelate. We then discuss takeaways from our empirical analysis for how we can measure DEV. Finally, we relate our analysis to the Action Plan 2018-2022 on transport for Stavanger municipality and highlight the import of our case study in a Norwegian urban context for emerging DEV research.
Our analysis identified several indicators related to multi-dimensional aspects of DEV at the sub-urban scale. Many of these are related to low-income households. For instance, unemployed respondents tended to rent rather than own their homes, spend a higher proportion of household income on electricity bills, and lack access to a car with low overall transport use. Some unemployed respondents received unemployment benefits from NAV, but none were beneficiaries of Enova subsidies and few were even aware of support schemes for home energy efficiency. Households with relatively low incomes and high proportions of energy expenses tended to exhibit more electricity-saving practices. In general, unemployed, middle-aged tenants were more likely to experience DEV, including the lack of access to a car as an aspirational mode of transport in a neighbourhood and city with uneven public transport coverage. We argue below that TEP more than DEP is subject to contextual, spatial and temporal factors that determine what constitutes ‘necessitated levels of transport services’ (Martiskainen et al., 2021). The experience of being in DEV in Østre Bydel may include being car-less, unemployed, and/or living in rental or social housing.
Thus, our study shows that energy vulnerability is experienced both within the household, as expressed through electricity-saving practices and voiced concerns, and in relation to transport modal choices, as evident in car accessibility and the expressed inability to access a personal vehicle. Indeed, a comparative study with other Norwegian cities finds Stavanger to be more car-friendly with lower accessibility by public transport and resistance to reducing numerous car parking spaces (Skartland 2021). While car accessibility is not a defining indicator for TEP (Martiskainen et al., 2021), it constitutes an important socio-economic element in the local context of Østre Bydel. Car-centric infrastructural development and limited access to public transport in the area creates preferential mobility opportunities for those with car access than for those who are limited to walking, bicycling and public transport. For instance, Næss et al. (2017) describe Stavanger as having low-density neighbourhoods, a polycentric layout with secondary centres besides Stavanger city centre in Sandnes and Forus, with much work commute to the latter, and relatively poor public transit options compared to the convenience of automobility prioritised through urban planning. Our analysis shows that participants who were more likely to experience DEV were limited in this way and had no self-reported prospects of acquiring a car. Although we do not hold that car-accessibility constitutes a necessitated level of transport, we argue that such a lack of access can significantly impede mobility for residents of Østre Bydel. This is evident in the trend of respondents we found least likely to be in DEP tending to own one or even multiple cars. Drawing on Allen and Farber (2020), we problematise the sociospatial inequalities that can result from low-income groups who reside in car-centric areas, and emphasise that future sub-urban scale studies of DEV should foreground a focus on lived experiences and on energy and mobility justice.
Our empirical analysis has illuminated several ways to measure DEV at the sub-urban scale that future research on how domestic and transport vulnerability intersect can further develop. We note that our methodology was better able to identify DEP than TEP, and that the analytical process produced important insight into elements of TEP that remain challenging to study where future studies can contribute to understanding of DEV. TEP requires more attention to granularity and context as it is contingent on ‘necessitated levels of transport services’ (Martiskainen et al., 2021). Thus its metricisation and monitoring must reflect a deep understanding of what constitutes a necessity for a given study area, which in turn may itself evolve, such as car-dependence in Østre Bydel with ambitious urban targets in place to move away from car-centric transport. The case of Østre Bydel further indicates that few people actively follow electricity price fluctuations or know their home energy certificate rating even when electricity prices have been surging for several months. This raises questions about the challenge of changing home and transport energy behaviour, especially amongst energy vulnerable population segments for whom energy cost savings matter relatively more.
The historically car-centric infrastructure and culture in Østre Bydel is likely to undergo a shift to new shared and collective modes of electrified and digitalised mobility during the 2020s. Stavanger municipality’s adoption of an Action Plan aligned with ambitious national and regional climate and environment targets downscaled to its urban transport sector envisage the substitution of private automobility by public transport, shared bicycle schemes and more walking (Stavanger Municipality, 2018a, 2018b). The municipality aims to facilitate more affordable and accessible public transport services, reduce parking in urban areas, and nurture a culture of bicycling and walking as measures to reach the mobility target where “70 per cent of passenger transport takes place by bike, foot and public transport in 2030” (Stavanger Municipality, 2018a: 5). Such a transformation, implemented in a manner mindful of the challenges that Øster Bydel’s households encounter in terms of exposure to DEV, could ensure broader access to mobility services alongside transitioning to a low-carbon transport system.
Thus, we offer timely insights for a just transition in Stavanger that can identify and include marginalised groups at the sub-urban scale during decarbonisation of multiple sectors. Exploring questions of DEV during ongoing socio-technical change enables engagement with justice aspects of transitions that can prevent existing inequalities from being re-produced in new systems. As a follow-up to this study, we are undertaking deeper empirical investigation of shared mobility solutions and the potential they may hold to enhance transport offerings with low energy consumption to residents of Stavanger, and the valuation of such options, as a contextually-relevant instance of metricisation to better understand and address TEP. Future DEV research can enable just transitions through contextualised metricisation of TEP in particular, in order to create an evidence base in support of equitable policies for decarbonisation.
The authors are grateful to the respondents who contributed their time and experiential perspectives to this study, to a grant from the Centre for Climate and Energy Transformation, University of Bergen, Norway, and to grant 321421 from the Research Council of Norway and JPI Climate for the ROLES project, that made this study possible.
Siddharth Sareen, Kjell Arholms gate 23, 4021 Stavanger, Norway. Email: siddharth.sareen@uis.no
Allen, J. and Farber, S. (2020) Suburbanization of transport poverty. Annals of the American Association of Geographers, 111, 6, 1833-1850. CrossRef link
Bang-Andersen, A. (1985) Stavanger: Historien om Østre bydel [Stavanger: The history of Østre Bydel]. Stavanger, Dreyer Bok.
Fearnley, N. and Aarhaug, J. (2019) Subsidising urban and sub-urban transport–distributional impacts. European Transport Research Review, 11, 49. CrossRef link
Beckhaug, A. (2021) Snaut 77 prosent valgdeltakelse [Around 77 percent turnout]. Dagbladet. Available at: https://www.dagbladet.no/studio/valg-2021/661?post=73356 [Accessed: 14/09/2021]
Benhabiles, J. H. and Bjørnstad, H. H. (2017) Storhaug: Velkommen inn i “Varmen”: En studie av gentrifisering og identitet. I: Stavangerregionen: Utvikling og omstilling: Feltrapport basert på studentoppgaver [Storhaug: Welcome to ‘Varmen’: A study of gentrification and identity. In The Stavanger region: Development and transformation: A field report based on student assignments], 203-226. Available at: https://spacelab.w.uib.no/files/2017/12/Feltrapport_GEO292_V2016.pdf [Accessed: 13/09/2021]
Bouzarovski, S. and Petrova, S. (2015) A global perspective on domestic energy deprivation: Overcoming the energy poverty–fuel poverty binary. Energy Research & Social Science, 10, 31-40. CrossRef link
Bredvold, T. L. (2020) “Where no one is poor, and energy is abundant”: A study of energy poverty in Norwegian households. Fridtjof Nansen Institute Report 2/2020. Available at: https://www.fni.no/publications/where-no-one-is-poor-and-energy-is-abundant-a-study-of-energy-poverty-in-norwegian-households [Accessed: 06/09/2021]
Enova (2021) Alle energitiltak [All energy measures]. Available at: https://www.enova.no/privat/alle-energitiltak/ [Accessed: 06/09/2021]
EU Energy Poverty Observatory. (2021) Indicators & Data. Available at: https://www.energypoverty.eu/indicators-data [Accessed: 14/09/2021]
Fevang, E., Figenbaum, E., Fridstrøm, L., Halse, A. H., Hauge, K. E., Johansen, B. G. and Raaum, O. (2021) Who goes electric? The anatomy of electric car ownership in Norway. Transportation Research Part D: Transport and Environment, 92, 102727. CrossRef link
Fjellså, I. F., Ryghaug, M., & Skjølsvold, T. M. (2021) Flexibility poverty: ‘locked-in’ flexibility practices and electricity use among students. Energy Sources, Part B: Economics, Planning, and Policy. CrossRef link
Funke, S.Á., Sprei, F., Gnann, T. and Plötz, P. (2019) How much charging infrastructure do electric vehicles need? A review of the evidence and international comparison. Transportation Research Part D: Transport and Environment, 77, 224-242. CrossRef link
Horta, A., Gouveia, J.P., Schmidt, L., Sousa, J.C., Palma, P. and Simões, S. (2019) Energy poverty in Portugal: Combining vulnerability mapping with household interviews. Energy and Buildings, 203, 109423. CrossRef link
Husbanken (2021) Housing allowance. Available at: https://www.husbanken.no/english/housing-allowance/ [Accessed: 07/09/2021]
Kelly, J.A., Clinch, J.P., Kelleher, L. and Shahab, S. (2020) Enabling a just transition: A composite indicator for assessing home-heating energy-poverty risk and the impact of environmental policy measures. Energy Policy, 146, 111791. CrossRef link
Korsnes, M. and Throndsen, W. (2021) Smart energy prosumers in Norway: Critical reflections on implications for participation and everyday life. Journal of Cleaner Production, 306, 127273. CrossRef link
Lowans, C., Del Rio, D.F., Sovacool, B.K., Rooney, D. and Foley, A.M. (2021) What is the state of the art in energy and transport poverty metrics? A critical and comprehensive review. Energy Economics, 101, 105360. CrossRef link
Martiskainen, M., Sovacool, B. K., Lacey-Barnacle, M., Hopkins, D., Jenkins, K. E., Simcock, N., Mattioli, G. and Bouzarovski, S. (2021). New dimensions of vulnerability to energy and transport poverty. Joule, 5, 1, 3-7. CrossRef link
Mattioli, G., Lucas, K. and Marsden, G. (2017) Transport poverty and fuel poverty in the UK: From analogy to comparison. Transport Policy, 59, 93-105. CrossRef link
Mayer, I., Nimal, E., Nogue, P. and Sevenet, M. (2014) The two faces of energy poverty: a case study of households’ energy burden in the residential and mobility sectors at the city level. Transportation Research Procedia, 4, 228-240. CrossRef link
NAV (2021) Arbeidsavklaringspenger [work clearance allowance] (AAP). Norwegian Labour and Welfare Administration. Available at: https://www.nav.no/aap [Accessed: 07/09/2021]
Nerlie, S. (2011) Kulturaksen Nytorget: Kultur som byutviklingsstrategi i Stavanger Øst. [The cultural axis: Culture as an urban development strategy in Stavanger Øst]. Master’s thesis, University of Stavanger.
Newell, P. and Mulvaney, D. (2013) The political economy of the ‘just transition’. The Geographical Journal, 179, 2, 132-140. CrossRef link
Næss, P., Cao, X.J. and Strand, A. (2017) Which D’s are the important ones? The effects of regional location and density on driving distance in Oslo and Stavanger. Journal of Transport and Land Use, 10, 1, 945-964. CrossRef link
Robinson, C. and Mattioli, G. (2020) Double energy vulnerability: Spatial intersections of domestic and transport energy poverty in England. Energy Research & Social Science, 70, 101699. CrossRef link
Robinson, C., Lindley, S. and Bouzarovski, S. (2019) The spatially varying components of vulnerability to energy poverty. Annals of the American Association of Geographers, 109, 4, 1188-1207. CrossRef link
Robinson, C., Yan, D., Bouzarovski, S. and Zhang, Y. (2018) Energy poverty and thermal comfort in northern urban China: A household-scale typology of infrastructural inequalities. Energy and Buildings, 177, 363-374. CrossRef link
Ryghaug, M., Skjølsvold, T. M. and Heidenreich, S. (2018) Creating energy citizenship through material participation. Social Studies of Science, 48, 2, 283-303. CrossRef link
Sareen, S. (2020) Social and technical differentiation in smart meter rollout: Embedded scalar biases in automating Norwegian and Portuguese energy infrastructure. Humanities and Social Sciences Communications, 7, 1, 1-8. CrossRef link
Sareen, S., Thomson, H., Tirado Herrero, S., Gouveia, J. P., Lippert, I. and Lis, A. (2020) European energy poverty metrics: Scales, prospects and limits. Global Transitions, 2, 26–36. CrossRef link
Sánchez, C.S.G., Fernández, A.S., Peiró, M.N. and Muñoz, G.G. (2020) Energy poverty in Madrid: Data exploitation at the city and district level. Energy Policy, 144, 111653. CrossRef link
Skartland, E.G. (2021) How interventions in master plans affect public transport competitiveness versus cars: a case study of two small and two medium-sized city regions. Urban, Planning and Transport Research (in press), 1-31. CrossRef link
Small, M.L. (2009) ‘How many cases do I need?’ On science and the logic of case selection in field-based research. Ethnography, 10, 1, 5-38. CrossRef link
Sovacool, B.K., Cooper, C., Bazilian, M., Johnson, K., Zoppo, D., Clarke, S., Eidsness, J., Crafton, M., Velumail, T. and Raza, H.A. (2012) What moves and works: Broadening the consideration of energy poverty. Energy Policy, 42, 715-719. CrossRef link
Statistics Norway (2020) Inntekt for husholdninger, etter region, statistikkvariabel, husholdningstype og år [Household income by region, statistical variables and household type]. Available at: https://www.ssb.no/statbank/table/06944/tableViewSorted/ [Accessed: 07/ 09/2021]
Statistisk Sentralbyrå. (2021). Elektrisitetspriser [Electricity prices]. Available at: https://www.ssb.no/energi-og-industri/energi/statistikk/elektrisitetspriser [Accessed: 14/09/2021]
Stavanger Municipality (2019) Den åttende levekårsundersøkelsen [Living conditions survey]. https://www.stavanger.kommune.no/om-stavanger-kommune/stavanger-statistikken/Levekaar-i-Stavanger/#ulikhetene-ker
Stavanger Municipality. (2018a) Action Plan 2018-2022. stavanger.kommune.no Available at: https://www.stavanger.kommune.no/siteassets/renovasjon-klima-og-miljo/miljo-og-klima/climate-and-environmental-action-plan–stavanger-2018-2022—final-version.pdf [Accessed: 13/09/2021]
Stavanger Municipality (2018b) Transport og mobilitet: Kommuneplanen 2019-2034. Available at: https://www.stavanger.kommune.no/siteassets/samfunnsutvikling/planer/kommuneplan/arealdel-pa-horing/vedlegg-07-transport-og-mobilitet.pdf [Accessed: 13/09/2021]
Thomson, H., Bouzarovski, S. and Snell, C. (2017) Rethinking the measurement of energy poverty in Europe: A critical analysis of indicators and data. Indoor and Built Environment, 26, 7, 879-901. CrossRef link
Thunold, A. (2021) Strømsjokket [Electric shock]. NRK. Available at: https://www.nrk.no/klima/xl/elektrifisering-oker-stromprisen—blir-regningen-rettferdig_-1.15539835 [Accessed: 06/09/2021]
Tirado Herrero, S. (2017) Energy poverty indicators: A critical review of methods. Indoor and Built Environment, 26, 7, 1018-1031. CrossRef link
Tuv, N. (2019) Disse kommunene har størst og minst inntektsulikhet. Statistics Norway. [These municipalities have the highest and least income inequality] Available at: https://www.ssb.no/inntekt-og-forbruk/artikler-og-publikasjoner/disse-kommunene-har-storst-og-minst-inntektsulikhet [Accessed: 07/09/2021]
Westskog, H., Winther, T. and Sæle, H. (2015) The effects of in-home displays: Revisiting the context. Sustainability, 7, 5, 5431-5451. CrossRef link
Winther, T. and de Lesdain, S.B. (2013) Electricity, uncertainty and the good life: A comparison of French and Norwegian household responses to policy appeals for sustainable energy. Energy and Environment Research, 3, 1, 71-84. CrossRef link