Social mobility measures how people’s social and economic status changes by family backgrounds. In a fair and equal society, ensuring some degree of social mobility would largely benefit the economic growth as socioeconomic advancements are rewarded according to one’s motivation and effort rather than purely determined by his family origins. Traditional sociological research has tended to measure social mobility at a national level whilst ignoring whether there are subnational differences in the pattern of mobility rates. However, a growing body of literature suggests such a negligence of the spatial dimension hides geographical variation across the country (Chetty et al., 2014; Friedman and Macmillan, 2017; Bell et al., 2018). Even if a society is experiencing an increasing level of social mobility in general terms, the national-averaged mobility rate would be of less relevance for the people living in depressed areas (Buscha et al., 2020).
The Social Mobility Commission (SMC) reports: “…Britain’s social mobility problem is not just one of income or class background… it is increasingly one of geography” (SMC, 2017). Another survey (SMC, 2020) reveals that only 31 per cent of respondents from the Northeast and 37 per cent of Wales believe they are provided with good life opportunities, which were significantly lower than that of London (78 per cent) and the Southeast (74 per cent). As such, it is seen that one’s lived experience is closely related to where they are from, people living in privileged areas would be “more equal” than those coming from elsewhere in terms of the access to social advancement. Understanding how socioeconomic effect manifests in different geographic conditions has been central to thinking about social inequalities for a country (Chetty et al., 2014).
Higher education is widely considered as a vehicle for upward social mobility, while student’s career outcomes have been given increasing weight in social mobility debates. Given the focus on graduate outcome and especially the access to professions in one’s early career stage, this study investigates the spatial inequality by estimating the relative chance that university graduates from different parts of Britain get into a high-class occupation after study finished. I used datasets from the Higher Education Statistics Agency (HESA), namely the HESA Student Record, which collects personal and academic information for students enrolled in a university, and the HESA Graduate Outcomes survey (2017 to 2018) collects labor market outcomes for the same sample. The high-class occupation is defined as managerial or professional by National Statistics Socio-economic Classification (NS-SEC).
Geographic studies tend to use administrative divisions with structured boundaries as spatial units for analysis, the drawback of this method is it always ignores the spatial relationships between observations and the visualization of result may be biased by the size of spatial units. In this study, the survey takes detailed locations for each student by which postcode area they are originally from (e.g., DH1 5). Longitude and latitude information were merged for each location by using a full package of UK postcode data provided by Office for National Statistics (ONS). In terms of the modelling, I included a kriging smoother in structural additive regression model running with a logistic link function, in which longitude and latitude of their geographic origin were introduced as continuous variables to define a two-dimensional Gaussian random field (see Umlauf et al., 2015). The model may better predict with data by enabling an autocorrelation function that explains the relationship between observations by the distance between them. A sample of 156732 graduates from 8811 locations was finally drawn in use. All analysis was done in R, I used R2BayesX package for regression analysis and leaflet/leaflet.extras packages for visualization.
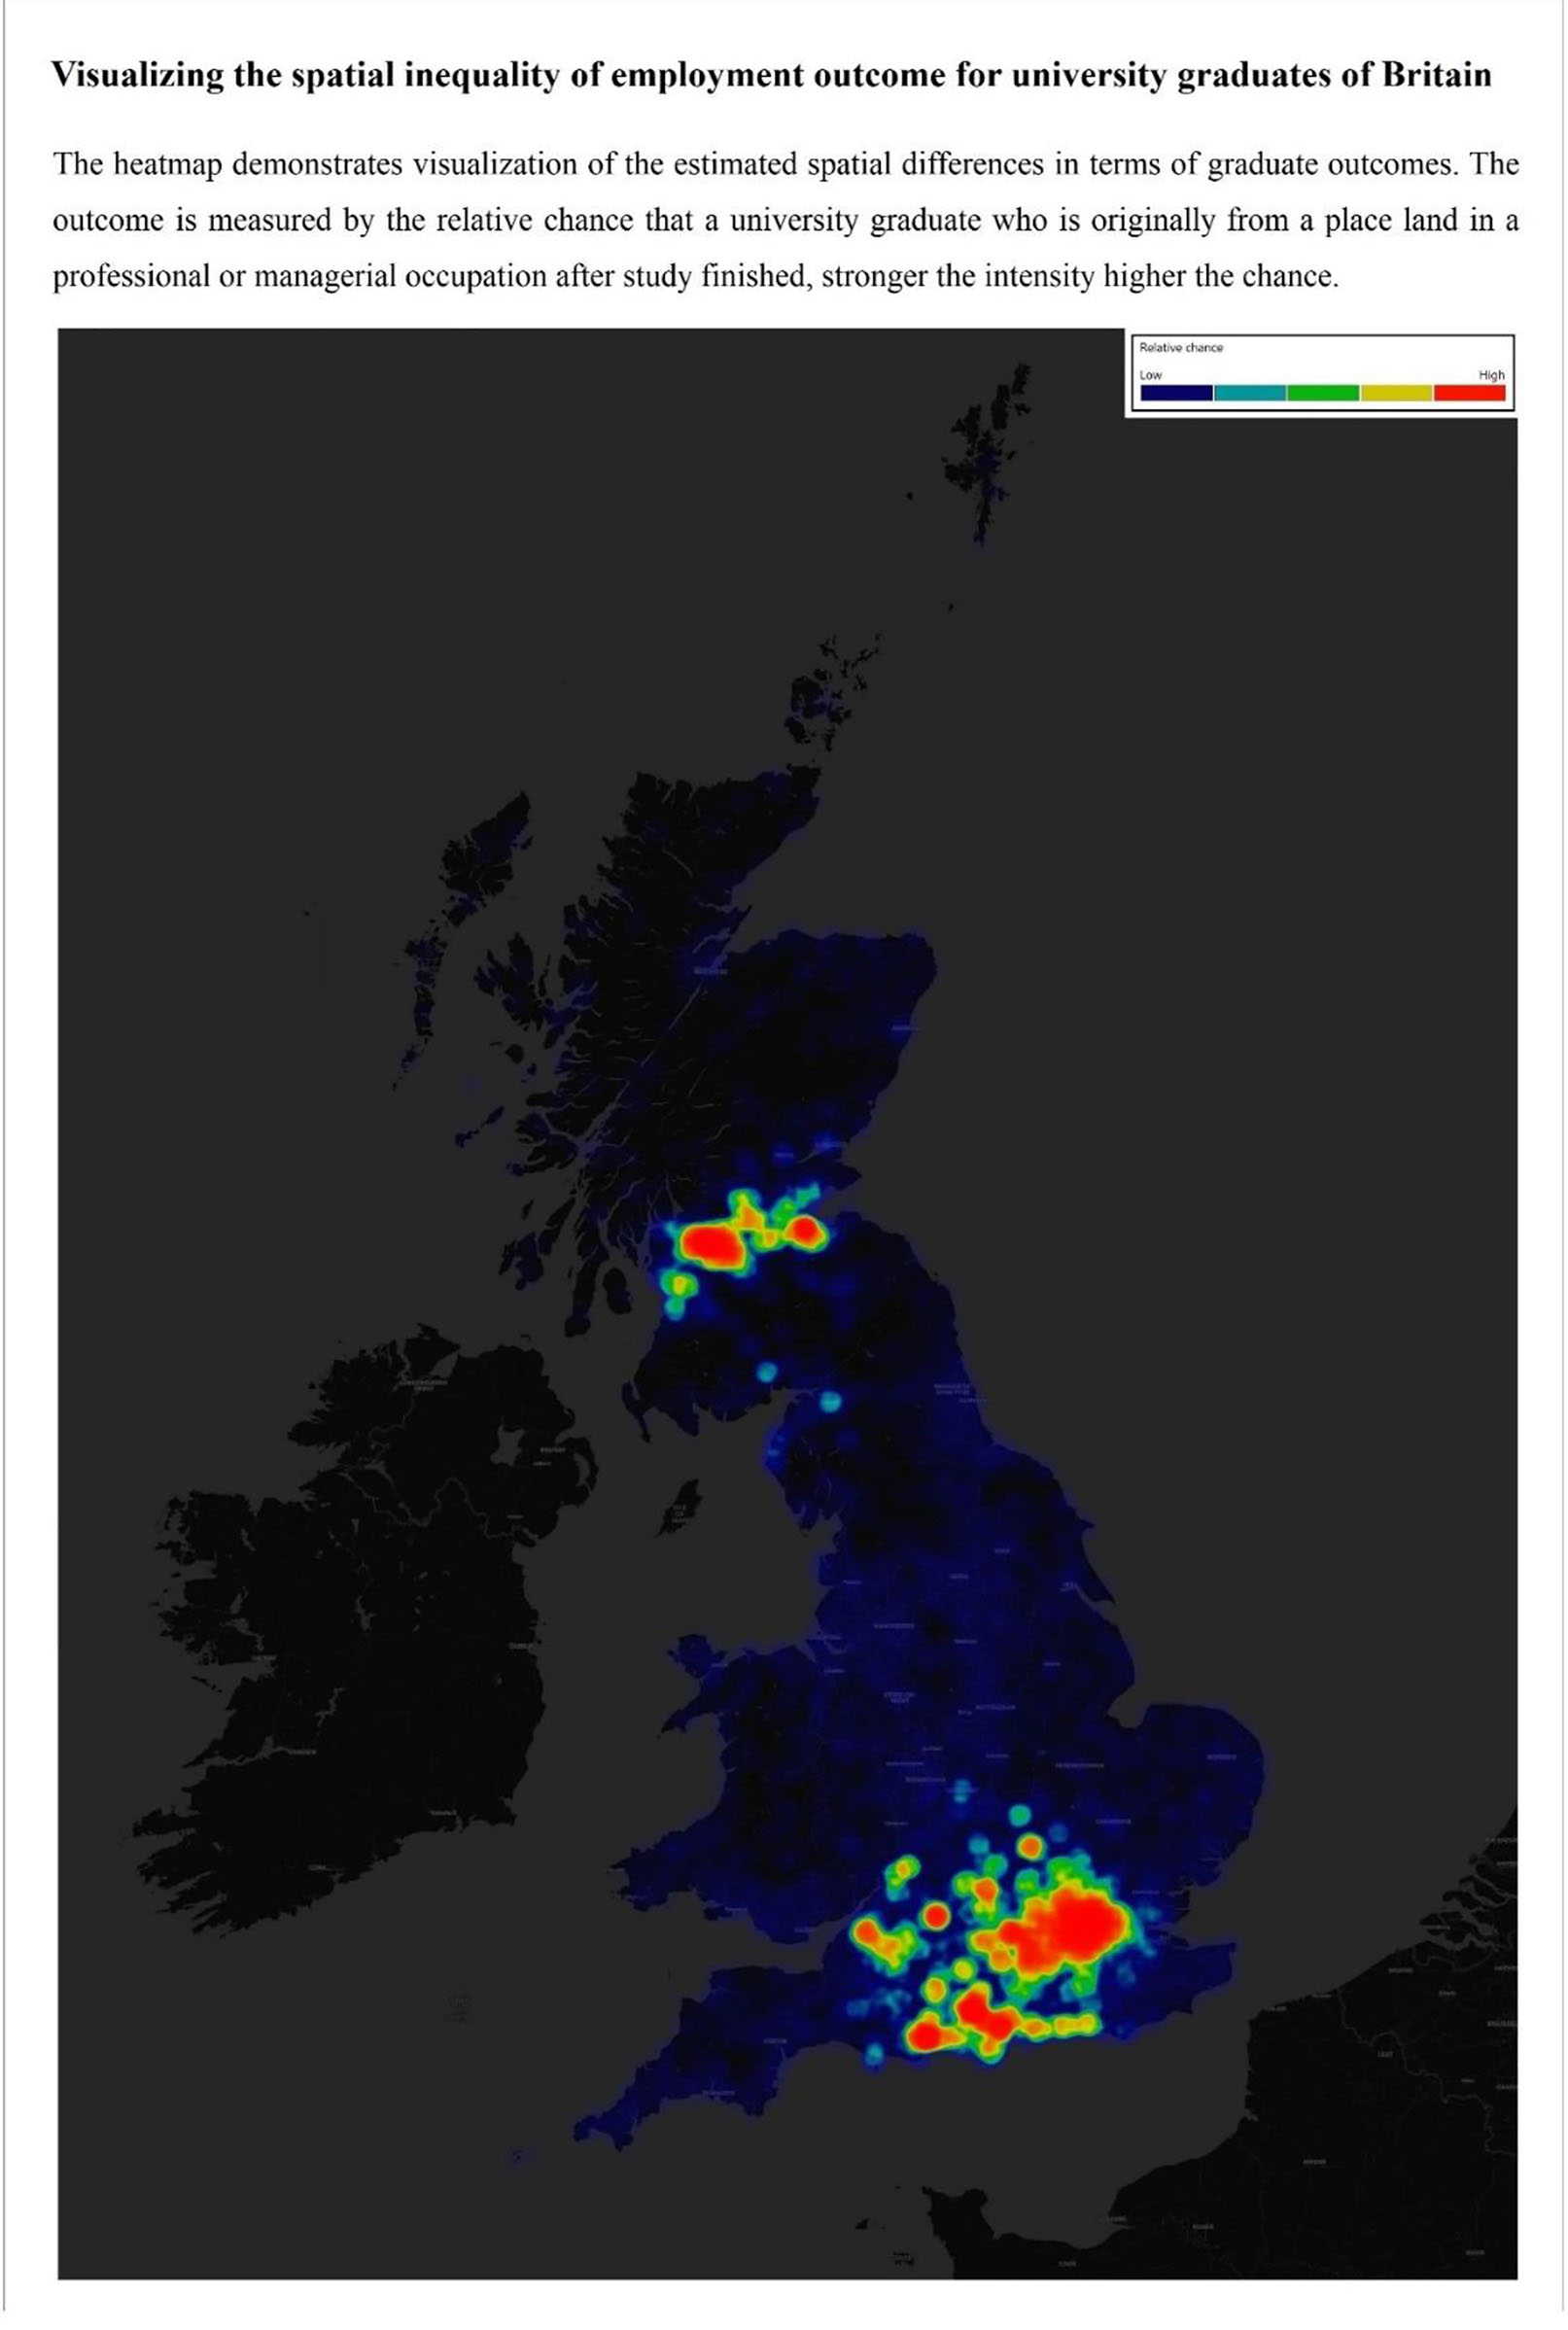
The plot demonstrates visualization of the estimated spatial differences of employment outcomes in a heatmap, the stronger the intensity the better the employment outcome. The odds ratio of being in a high-class occupation is ranged from 1.64 to 2.62, it suggests they are considerable spatial variations in graduate outcome by geographic origin. In England, a clear North-South divide is present where graduates originally from London and peripheral areas could see a better chance to get in a professional occupation than their peers from elsewhere. Besides, South coast (e.g., Southampton, Portsmouth and Bournemouth), Oxford, Coventry, Swindon and some cities nearby M5 corridor (e.g., Bristol, Gloucester) etc., are also found with decent employment outcomes. Glasgow and Edinburgh serve as local hotspots for Scotland. However, the same does not appear to be the case for Wales. Furthermore, it also demonstrates some patterns of urban-rural difference, strong intensity is almost centered over metropolis and cities, provincial and coastal areas are found with deep-rooted disadvantages for employment.
R Studio 4.0.2.
Bell, B., Blundell, J. and Machin, S. (2018) Where is the Land of Hope and Glory? The Geography of Intergenerational Mobility in England and Wales. In: CEP Discussion Papers (No. dp1591; CEP Discussion Papers). Centre for Economic Performance, LSE. Available at: https://ideas.repec.org/p/cep/cepdps/dp1591.html
Buscha, F., Gorman, E. and Sturgis, P. (2020) Spatial and Social Mobility in England and Wales: Moving Out to Move On? 35. CrossRef link
Chetty, R., Hendren, N., Kline, P. and Saez, E. (2014) Where is the land of Opportunity? The Geography of Intergenerational Mobility in the United States. The Quarterly Journal of Economics, 129, 4, 1553–1623. CrossRef link
Friedman, S. and Macmillan, L. (2017) Is London Really the Engine-Room? Migration, Opportunity Hoarding and Regional Social Mobility in the UK. National Institute Economic Review, 240, 1, R58–R72. CrossRef link
Social Mobility Commission (SMC) (2017) State of the nation 2017: Social mobility in Great Britain. The Commission.
Social Mobility Commission (SMC) (2020) Social Mobility Barometer: Public attitudes to social mobility in the UK. London, 37.
Umlauf, N., Adler, D., Kneib, T., Lang, S. and Zeileis, A. (2015) Structured Additive Regression Models: An R Interface to BayesX. Journal of Statistical Software, 63, 21. CrossRef link