Understanding the local labour market is essential for UK Combined Authorities and Local Enterprise Partnerships to drive regional economic growth in line with the national Levelling Up agenda (Nurse and Skyes, 2020; Harari et al., 2021). The UK socio-economic landscape has been riddled with disparities for decades and the Levelling Up agenda strives for a more place-based approach to rectify these inequalities. Therefore, it is vital for regions to utilise data-driven insights to build effective place-sensitive policies to foster sustainable development.
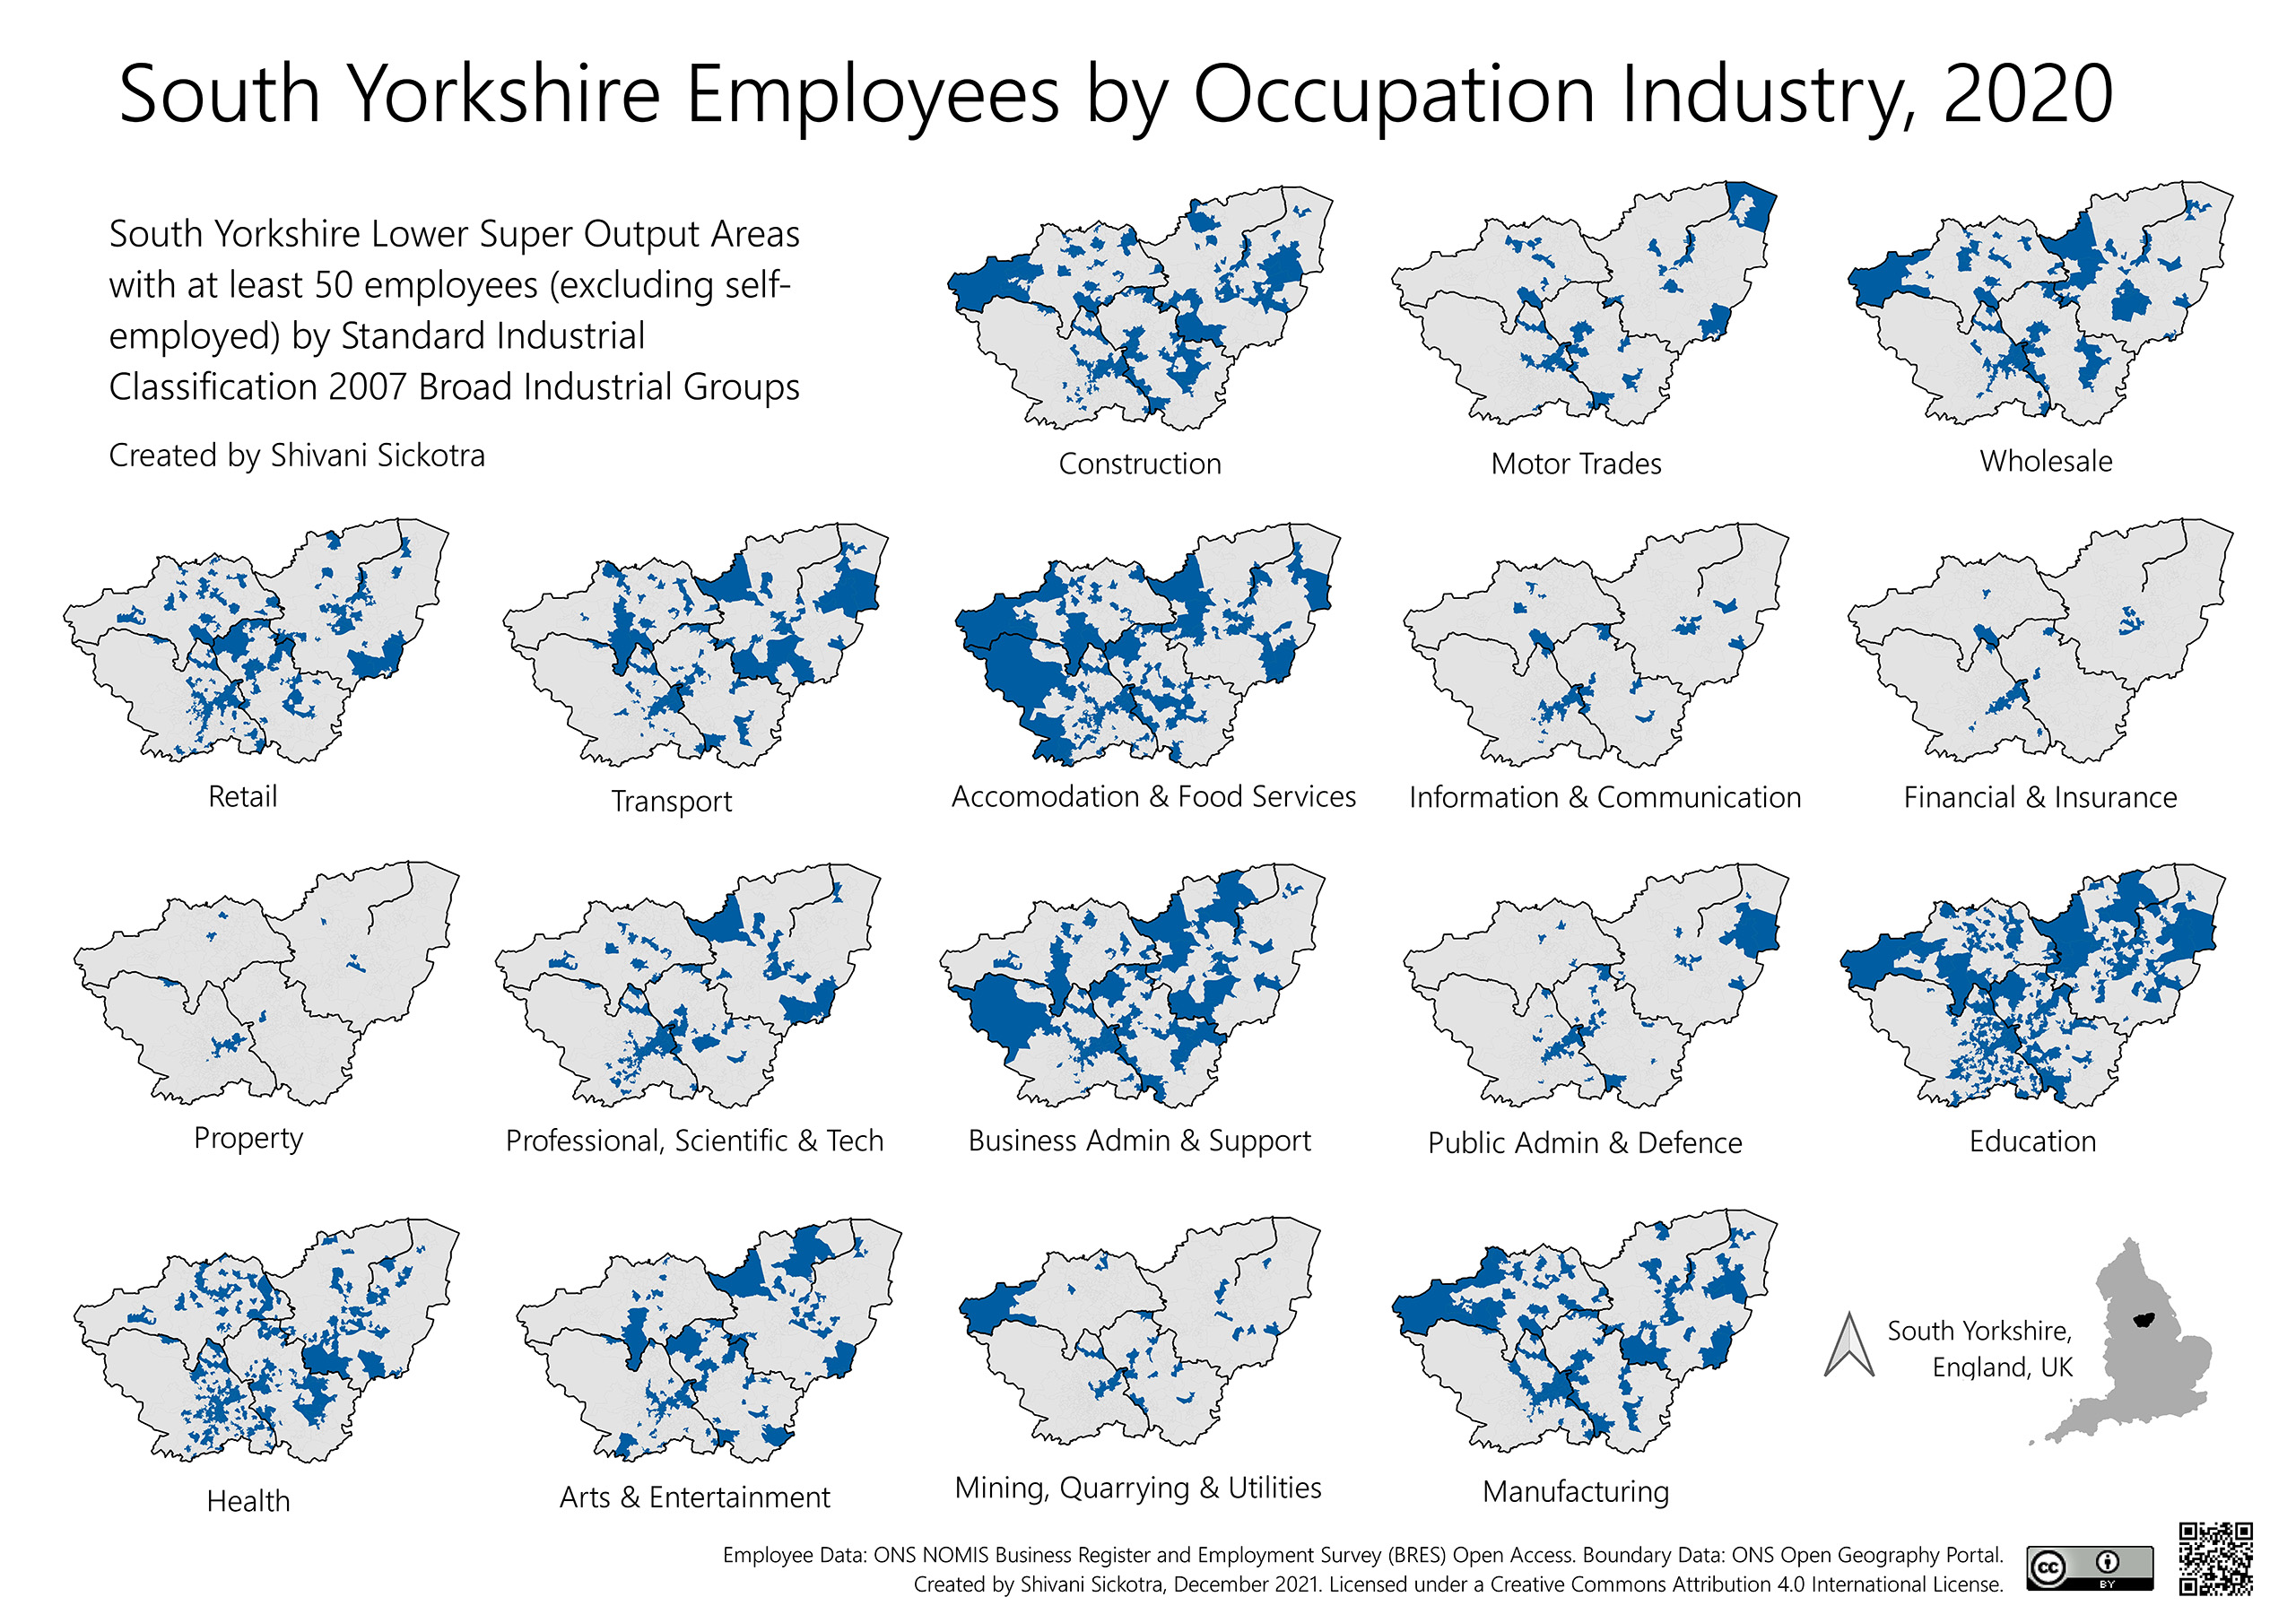
The South Yorkshire Mayoral Combined Authority (SYMCA) is currently formulating a Skills Strategy and a refreshed Strategic Economic Plan for the region. This small multiple geo-visualisation focuses on the SYMCA region and disaggregates employees by their occupation industry at the Lower Super Output Area (LSOA) level. The visualisation is designed to provide an overview of the spatial distribution of each broad industrial group specified in the 2007 Standard Industrial Classification (ONS, 2016). This mapping was intended to provide SYMCA with a data-informed perspective of the local labour market and contribute to strategic decision making regarding their skills economy. As a result, the mapping has been included within a special addition ‘Local Data’ section feature in the recent SYMCA policy briefing (Sickotra, 2023).
Within South Yorkshire, the ‘Education’, ‘Business Admin & Support’ and the ‘Accommodation & Food Services’ are the most spatially distributed industry groups. In contrast, employees in the ‘Information & Communication’, ‘Financial & Insurance’ and ‘Property’ industries are very spatially concentrated and found only in a small number of LSOAs across the region. This key finding is useful since it can indicate which areas SYMCA should focus resource allocation, infrastructure or policy recommendations to either nurture the existing spatial distribution of employee occupation industries or disrupt the pattern based on their priorities. For example, for the region to achieve a more balanced skills economy that is more resilient to economic shocks (Sensier and Devine, 2020), the extremely spatially concentrated industry groups should be prioritised to allow these sectors to expand across the region. In this regard, this visualisation can be incredibly powerful for place-based regional and local interventions since it summarises the key industry sectors and the specific LSOAs that SYMCA must develop in order to achieve a strong labour-market and promote sustainable economic growth.
The geo-visualisation was produced using the open-source software QGIS 3.16.11 and utilised open access data. Employment data was obtained from the Business Register and Employment Survey (BRES) published by the ONS (2020). This was reformatted to remove metadata, delete empty columns, rename attributes and saved as a .csv file[1]. Local Authority District (LAD) and LSOA boundary shapefile data was obtained from the Open Geography Portal (ONS, 2021).
The QGIS project Coordinate Reference System (CRS) was set to OSGB36 British National Grid ESPSG: 27700 to match the shapefile CRS. The LSOA layer was clipped to the extent of the SYMCA area, and the BRES data was imported as delimited text and joined to the LSOA layer using LSOA codes. The automation tools, Graphical Modeler and batch processing, were used with the resultant layer to produce 17 layers for each of the 17 industries where the number of employees was greater than or equal to 50. A single colour was chosen to symbolise the batch processed layers as multiple colours would have been visually challenging and may distract from any spatial patterns between the occupation industries (Darkes et al., 2017). A dark blue was chosen against a light grey background to increase the prominence of employees in each LSOA.
The small multiple geo-visualisation was created within the QGIS Print Layout. Explanatory text, a north arrow, an inset map providing geographical context, data source and authorship details were arranged to achieve visual balance. A scale bar was not included as the visualisation was only intended to provide a spatial overview of employee occupation industries, rather than focus on distances. LAD boundaries were also included to provide context. The sans serif ‘Segoe UI Semilight’ font was used to ensure text was visually appealing and easily readable. Moreover, a white background was selected to accommodate for sustainable printing if required (Darkes et al., 2017).
This work was supported by the Economic and Social Research Council [Grant 2433665, https://gtr.ukri.org/person/D902BA77-4541-4946-AAAB-380E10550520] and the South Yorkshire Mayoral Combined Authority. The funding sources were not involved regarding the preparation of the article in study design; in the collection, analysis and interpretation of the data; in writing of the report; and in the decision to submit the research for publication. Thank you to Dr Ruth Hamilton for teaching the methods used to produce this geo-visualisation which was submitted as part of the assessment required for the TRP620 Open-Source GIS and Spatial Data Analysis module at the University of Sheffield.
Shivani Sickotra, University of Sheffield, Sheffield Methods Institute, The Wave, 2 Whitham Road, Sheffield, S10 2AH. Email: ssickotra1@sheffield.ac.uk
Darkes, G., Kent, A., Wesson, C., Spence, M., Tyner, J., Muehlenhaus, I. and Scoffham, S. (2017) Part IV – Understanding Cartographic Design: Principles in Practice. In: Kent, A. J. and Vujakovic, P (eds) The Routledge Handbook of Mapping and Cartography. New York: Routledge, 285-388.
Harari, D., Hutton, G., Keep, M., Powell, A., Sandford, M. and Ward, M. (2021) House of Commons Library: The Levelling Up Agenda. Available at: https://researchbriefings.files.parliament.uk/documents/CDP-2021-0086/CDP-2021-0086.pdf [Accessed: 28/07/21].
Nurse, A. and Skyes, O. (2020) Place-based vs. place blind? – Where do England’s new local industrial strategies fit in the ‘levelling up’ agenda? Local Economy: The Journal of the Local Economy Policy Unit, 35, 4, 277-296. CrossRef link
Office for National Statistics [ONS] (2016) UK SIC 2007. Available at: https://www.ons.gov.uk/methodology/classificationsandstandards/ukstandardindustrialclassificationofeconomicactivities/uksic2007 [Accessed: 26/12/21].
Office for National Statistics [ONS] (2020) Business Register and Employment Survey: open access. Available at: https://www.nomisweb.co.uk/datasets/newbres6pub [Accessed: 26/12/21].
Office for National Statistics [ONS] (2021) Open Geography Portal. Available at: https://geoportal.statistics.gov.uk/ [Accessed: 23/12/21].
Sensier, M. and Devine, F. (2020) Understanding Regional Economic Performance and Resilience in the UK: Trends since the Global Financial Crisis. National Institute Economic Review, 253, R18-R28. CrossRef link
Sickotra, S. (2023) Local Data: South Yorkshire Employees by Occupation Industry, 2020. South Yorkshire Mayoral Combined Authority Weekly Policy Briefing, 10 February 2023, 14-16.