Abstract
Welfare ‘reform’ and the need to reduce expenditure on working-age benefits were at the heart of the Coalition government’s deficit reduction strategy. It has been suggested these measures have been accompanied by a strategy to ‘manufacture ignorance’ about the causes of unemployment and poverty, by ignoring structural factors and focusing instead on the ‘dysfunctional’ behavioural traits of benefit recipients. This paper examines the extent of public knowledge about the scale and scope of the cuts in welfare benefits, based on the results of a small scale survey. It links differences in awareness of patterns in benefits expenditure to underlying attitudes towards welfare. The responses suggest that those who are more knowledgeable about patterns of welfare benefit tend to take a more positive view towards benefit recipients. Put another way, the ‘production of ignorance’ is likely to prompt more punitive attitudes towards welfare claimants.
Introduction
Welfare reform has become one of the most highly charged and contested political issues of our time. Debates about the future of the benefits system are centre stage at the general election, which is imminent as this paper is published. David Cameron announced in February 2015, for example, that the total benefits cap for working-age households would be reduced from £26,000 to £23,000 per annum in the first week of an incoming Conservative Government. There are also plans to abolish the entitlement of anyone under 21 years old to claim Housing Benefit, or, under Labour proposals, to link Housing Benefit eligibility to job search behaviour. Over the past five years, the Coalition Government’s policies to reduce expenditure on a range of benefits for working-age households are often thought to have met with considerable public support, although a closer analysis suggests that public responses are more equivocal than often supposed, as discussed later in the paper.
How much of the public reaction is based on myth, misinformation and the impact of TV media programmes such as Benefits Street, which ‘function to embed new forms of ‘commonsense’ about welfare and worklessness’ (Jensen (2014: 1.2; see also Pykett, 2014)? Public discourse has become saturated with rhyming soundbite dualisms (shirker/worker; striver/skiver) and pejorative stereotypes of teenage mothers, feckless fathers, troubled families and fraudulent claimants (collectively described as ‘national abject’ figures by Tyler (2013)). Tom Slater (2012) has written about how the think tank the Centre for Social Justice has been engaged in agnotology, the ‘production of ignorance’ on the subject of welfare reform, ‘to manufacture doubt with respect to the structural causes of unemployment and poverty, and to give the impression that “welfare” is a lifestyle choice made by dysfunctional families despite the fact that considerable social scientific evidence shatters that impression’ (p.950). The survey reported in this paper reflects on the effectiveness of this strategy.
As part of its contribution to the Economic and Social Research Council’s (ESRC) Festival of Social Science held in Sheffield in November 2014, members of staff at CRESR undertook a brief survey of people’s attitudes towards the welfare system, and especially on expenditure on different welfare benefits. The exercise was designed to assess the extent of knowledge about different facets of the benefits system and the various policy changes and expenditure cutbacks that have been made since 2012. This is a discussion paper based on this research, intended to provoke debate and further comment. The results are not based on an extensive survey, and all the findings should therefore be treated with due caution. They are suggestive rather than conclusive, but they are intended to point out potential relationships and issues that need more systematic future investigation.
The survey exercise took place in Sheffield city centre in a couple of two hour sessions on November 3rd 2014. The research team had a base in Sheffield city centre, close to a busy indoor thoroughfare for shoppers and office workers. Passing members of the public were approached and asked if they wished to ‘Take the Welfare Reform Challenge’ by completing a brief questionnaire; those who agreed to do so then completed the questionnaire. Several questions in the survey deliberately repeated the wording of questions posed in the annual British Social Attitudes surveys of public attitudes to welfare, to enable comparison. The questionnaires were completed anonymously and respondents were then invited to discuss their answers on completion, and all but four agreed to do so. This gave participants the opportunity to express their attitudes towards welfare reform and to consider their responses to the factual questions alongside the correct answers. Respondents were given a £5 voucher in recognition of their contribution to the exercise.
The number of respondents (62) is too small to undertake tests of statistical significance over any differences in response. Furthermore, the respondents were self-selecting and not chosen to provide a representative sample of the wider population. The modest purpose of the exercise was to engage with members of the public on an issue of considerable public concern, and to show how a brief social survey might contribute a little to developing a wider understanding of a subject coated in myth, misapprehension and prejudice.
Two of the 62 respondents did not complete part of the questionnaire (on knowledge of the welfare system) as they felt they were not sufficiently informed to do so. This did not, however, deter the majority of respondents. Participants were reassured from the outset that they were not expected to have a detailed knowledge of public expenditure on welfare or of the impact of the cutbacks on different parts of the benefits system.
In the next section, the main policy initiatives that have informed the Government’s welfare reform programme are outlined.
The welfare reform agenda
The need to reform the welfare state, and the allied concern to reduce public expenditure on (selected) welfare benefits, has of course been at the heart of the Coalition Government’s programme from May 2010 onwards. It is, however, worth recalling that the genesis of the need for an overhaul of the welfare system can be traced to a series of reports and reviews undertaken by the preceding Labour Government between 2006 and 2008.
The 2006 Green Paper, A New Deal for Welfare: empowering people to work (DWP, 2006), made the case for welfare reform on the basis that the ‘existing system encouraged the poverty trap of welfare dependency’ (p2) that the government needed to address. It focused on Incapacity Benefit (IB) claimants, lone parents and older people. In 2007 Lord Freud produced an independent report (Freud, 2007) of the welfare-to-work regime, placing more responsibility on claimants to find work, backed by a new ‘conditionality’ regime of sanctions. This was subsequently framed in the 2008 White Paper Raising Expectations and Increasing Support: reforming welfare for the future (DWP, 2008).
In 2010 the incoming Coalition Government continued this strategy, but pressed harder on the pedals. The emphasis on responsibility and independence was reinforced, and linked to a particular conception of achieving ‘fairness’ in the benefits system. The need to achieve savings on welfare expenditure was strongly emphasised as a central part of the Government’s overall deficit reduction programme. The degree of continuity with the preceding administration was reinforced when the erstwhile adviser to the Labour Government, Lord Freud, was appointed as Welfare Reform Minister in the Coalition Government.
The Coalition Government published a consultation paper, 21st Century Welfare (DWP, 2010a) in their first few months in office and followed this up with a White Paper – Universal Credit: welfare that works – which set out their ‘commitment to overhaul the benefit system to promote work and personal responsibility’ (p2). The White Paper stressed the need to contain expenditure on the welfare system, while exempting some benefits, notably the state pension, from any reductions. Many of these proposals were duly enshrined in the Welfare Reform Act 2012.
When fully implemented by 2014/15, the welfare reforms are estimated to reduce expenditure by almost £19bn a year. Aside from the state pension, few stones were left unturned in the drive for ‘reform’. For example, changes were made to Housing Benefit (HB) in the private rented sector through modifying the rules governing assistance with the cost of housing for low-income working-age households through the system of Local Housing Allowances (LHAs). The new rules applied to rent levels, ‘excess’ payments, property size, age limits for sole occupancy, non-dependant deductions and indexation for inflation (for a discussion of the various measures, see Beatty et al., 2014). The Removal of the Spare Room Subsidy (also known as the ‘bedroom tax’) reduced Housing Benefit for hundreds of thousands of working-age claimants in the social rented sector who were deemed to be under-occupying their homes (Wilcox, 2014).
A household benefit cap was introduced, applying a new ceiling on total payments that could be made per household, applying to the sum total of different benefits received by working-age claimants. From April 2013, a ten per cent reduction in central funding for Council Tax Benefit (CTB) for working-age households in Great Britain (GB) was introduced, although the implementation of the scheme was devolved to local areas. The Disability Living Allowance (DLA) was replaced by Personal Independence Payments (PIPs), including more stringent and frequent medical tests, as the mechanism for providing financial support to help offset the additional costs faced by individuals with disabilities. Incapacity Benefit (IB) and related benefits were replaced by the Employment and Support Allowance (ESA), with more stringent medical tests, greater conditionality, and time limitations placed on non-means tested entitlement.
Child Benefit rates were frozen for three years, with the phased withdrawal of benefit from households which included a higher earner. Reductions were made in payment rates and eligibility for Child Tax Credit and Working Families Tax Credit. The rate of the annual uprating of the value of most working-age benefits was also fixed at a maximum of one per cent (or the rate of inflation, if lower) for 2014/15 and 2015/16. It is hardly surprising that even informed commentators, let alone lay members of the public, have found it difficult to keep up with this blizzard of changes – to eligibility, rates, the method for annually uprating benefits, transitional support for some claimants (for example, through Discretionary Housing Payments), through to the sanctions and conditions placed on some benefit claimants.
Of course, the various Government reports, proposals, policy changes and procedural adjustments have not been introduced into a vacuum, but have run alongside an often heated public discourse about spending on benefits, the extent of inequality and poverty, the myth or reality of widespread ‘benefit dependency’ and its assumed impact on lifestyles and attitudes (Hills, 2014). Campaigns by some newspapers have regularly ‘exposed’ benefit cheats in various guises, while TV programmes such as Benefits Street have tended to focus on biography and behaviour rather than on more structural factors and erroneously suggest that intergenerational cultures of worklessness are endemic in some communities (Macdonald et al., 2014). The enthusiasm with which the Government has pursued its agenda of reform, and the fairly lukewarm and selective criticism of the proposals by the Opposition, suggests that politicians sense that public attitudes are rapidly hardening against those who are in receipt of benefits. But what evidence do we have that this is the case?
The continuing salience of public concerns about benefits and welfare is undeniable, although perhaps not as marked as often assumed. In a recent edition of the monthly Issues Index produced by The Economist/Ipsos MORI, in January 2015, respondents were asked to name the ‘most important issue facing Britain today’, and just one per cent mentioned pensions/welfare/benefits, while nine per cent mentioned it as ‘another important issue’. It was the twelfth most frequently mentioned issue. This compared with 18 and 45 per cent respectively who mentioned the NHS, and 16 and 43 per cent who mentioned immigration, itself a close cousin to many debates about benefit spending. It would also be misleading to encapsulate public concerns as overwhelmingly negative towards the poor. Public concern about poverty/inequality has steadily increased in prominence since 2011, and was mentioned by 16 per cent of respondents as an important issue in January 2015, and the same proportion of respondents mentioned low pay/minimum wage as an important issue of concern as benefits. Public attitudes towards welfare are not irredeemably negative.
In the following section, the attitudes of the 62 respondents are assessed in what is then termed in this paper the Sheffield survey. At several points, the findings are considered against the responses to comparable questions asked in the annual British Social Attitudes survey.
Attitudes to welfare
Of the 62 respondents, 37 (61 per cent) were female and 33 (54 per cent) were in full-time or part-time paid work. Of the 59 respondents who stated their age, 13 (22 per cent) were under 25 years old, 13 (22 per cent) were 25 to 45 years old, 17 (29 per cent) were 46 to 64 years old, and 16 (27 per cent) were 65 or over. There was therefore a relative over-representation in the sample compared to the national average of women, those under 25 years old and over 65 years old, and those not in paid work.
Table 1 below indicates how respondents described their current financial position, following the terminology used in the British Social Attitudes (BSA) survey undertaken in 2013 and published last year (British Social Attitudes 31). Clearly, this is based on self-assigned status rather than any objective measures of income, but it was considered that this perception of financial position might influence attitudes to welfare spending more generally. The results show that just under half of respondents overall (49 per cent) thought they were living ‘really comfortably’ or ‘comfortably’ on their present income – slightly higher than the 44 per cent of working households in the BSA survey. Forty per cent said they were ‘neither comfortably off nor struggling’ (similar to the 38 per cent in the BSA survey) and ten per cent (18 per cent in the BSA survey) said they were ‘struggling’ or ‘really struggling’. The relationship between these designations and attitudes to welfare is considered later in the paper.
Table 1: Self-assigned standard of living
Table 2 below shows responses to a series of statements about the level of welfare spending and about the deservingness or otherwise of different groups of benefit claimants. Several of the statements are the same as those used in previous BSA surveys, to enable comparison. In terms of statement 2A, over the years BSA surveys have shown that the proportion of those agreeing that the Government should spend more fell consistently, from 42 per cent in 2002 to 28 per cent by 2011. It then increased again to 36 per cent in 2013. Table 2 shows a higher level of support in the Sheffield survey for more government spending at 44 per cent. Conversely, the proportion of those disagreeing with the statement has steadily increased in the BSA surveys from 26 per cent in 2002 to 39 per cent in 2011, to fall back to 32 per cent in 2013. A higher proportion, 42 per cent, of respondents in the Sheffield survey said they did not agree with more Government spending, with a much smaller proportion undecided on this issue than in the BSA surveys.
Statement 2B also repeats the phrase used in BSA surveys. Twenty nine per cent of respondents in the Sheffield survey thought that ‘unemployed people could get a job if they really wanted one’ – considerably lower than in the BSA surveys, where the proportion agreeing with this statement has fallen from 70 per cent in 2005 to 54 per cent in 2013. The proportion of respondents in the Sheffield survey who agreed that ‘many people who get social security do not deserve help’ (Statement 2C) was just ten per cent, compared to 33 per cent in the 2013 BSA survey (down from 40 per cent in 2005). Nearly three quarters of respondents in the Sheffield sample disagreed with this statement. Similarly, the proportion of respondents in the Sheffield survey who say that ‘most people on the dole are fiddling one way or another’ (Statement 2D) is just eight per cent, compared to a figure of 33 per cent in the 2013 BSA survey (down from 39 per cent in 2005).
Compared to the other statements, a higher proportion of respondents in the Sheffield survey (35 per cent) did agree that ‘large numbers of people these days falsely claim benefits’ (2E). This is still considerably lower than the 77 per cent who agreed with the statement in the 2013 BSA survey (down from 84 per cent in 2006). Respondents were also asked about two other issues affecting benefit claimants. The first statement (2F) assessed the level of support for the idea that those households receiving Housing Benefit should be forced to live in the cheapest properties in the rental market. The changes to Housing Benefit (through lower Local Housing Allowance rates) in the private rented sector, for example, are making it increasingly difficult for households to stay put, given the increased shortfall between their benefit and their rent. The extent of enforced mobility has so far been relatively limited (apart from in London) (Beatty et al., 2014) but the ability of many households and families to remain in place is likely to come under increasing pressure in the next two to three years. Table 2 shows that just under a fifth of respondents felt that HB claimants should be forced to live in the cheapest ten per cent of properties in the rented market.
Statement 2G makes reference to the remarks made by the Minister for Welfare Reform, Lord Freud, in October 2014 at a conference fringe event, when he was asked whether it was preferable for someone with a disability who could not get a job to be paid less than the minimum wage – and to have their income topped up with benefits – in order to give them the experience of work and boost their self-esteem. His response attracted widespread criticism from across the political spectrum and caused Lord Freud to issue an apology for his ‘deeply offensive’ comments. The results in Table 2 show that this instance of ‘thinking outside the box’ was certainly not striking a chord with the public mood. Only one respondent agreed with the sentiments expressed in this remark. Eighty five per cent disagreed.
Table 2: Attitudes to welfare and government expenditure
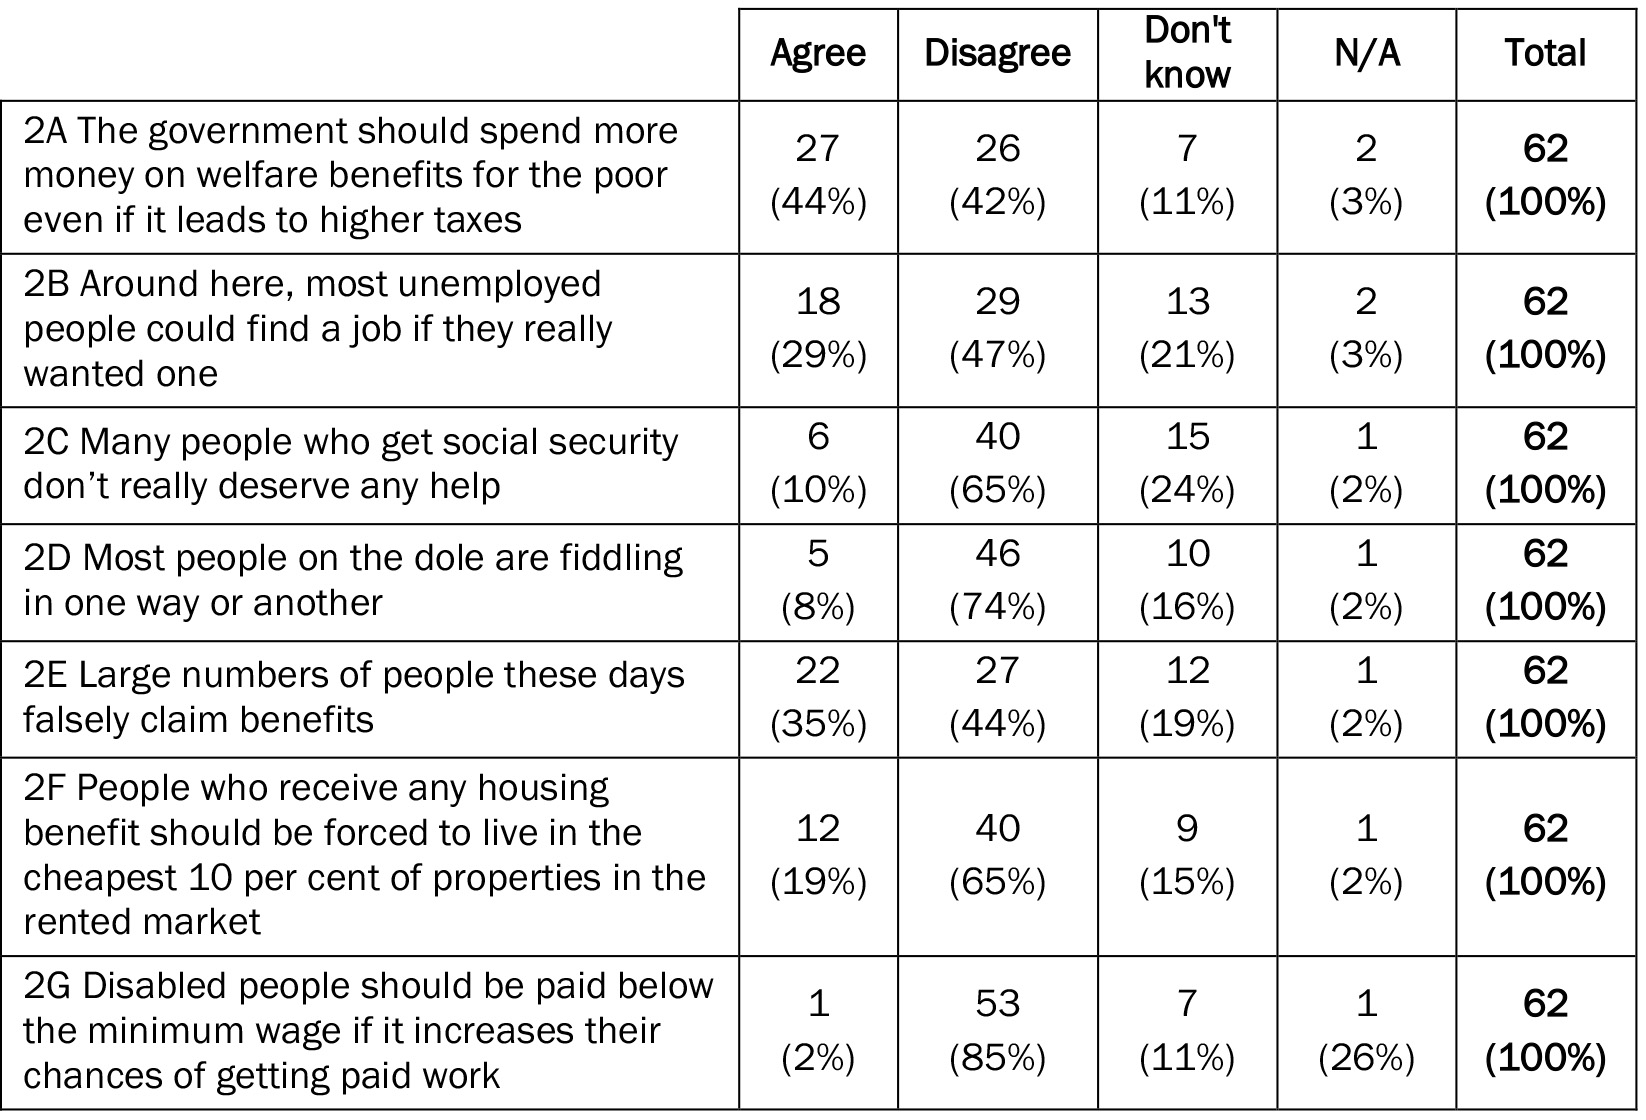
Table 3: Attitudes to the level of benefits for unemployed people
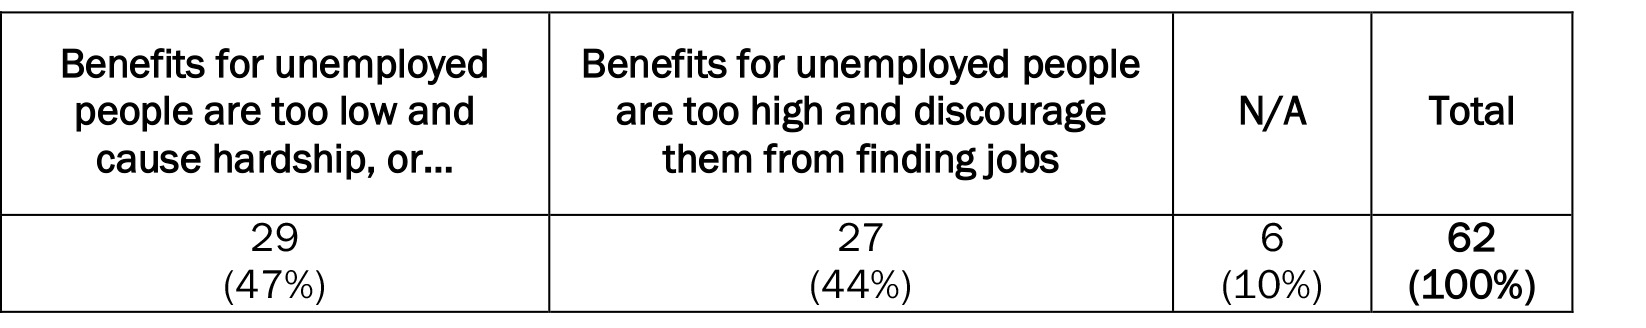
Table 3 shows that there is a fairly even split between those respondents who felt that benefits for unemployed people were too high and those who felt they were too low. The proportion of respondents feeling that benefits were too high in the annual BSA surveys has varied from 54 to 62 per cent between 2004 and 2013. In 2013, 57 per cent of respondents felt that the level of benefits was too high and 22 per cent that it was too low. The responses were much more evenly balanced in the Sheffield sample.
Overall the results presented in Table 2 and Table 3 show that the responses in the Sheffield survey were considerably more ‘pro-welfare’ than in the BSA surveys. A lower proportion of respondents felt there was widespread cheating among benefit claimants or that the level of benefits for unemployed people was too high. However, this more benign attitude was not extended equally to all groups of claimants in terms of whether the government should spend more, less or the same. Responses were more nuanced, and varied according to different categories of claimant, as Table 4 below shows.
Table 4: Attitudes to future levels of expenditure on different groups
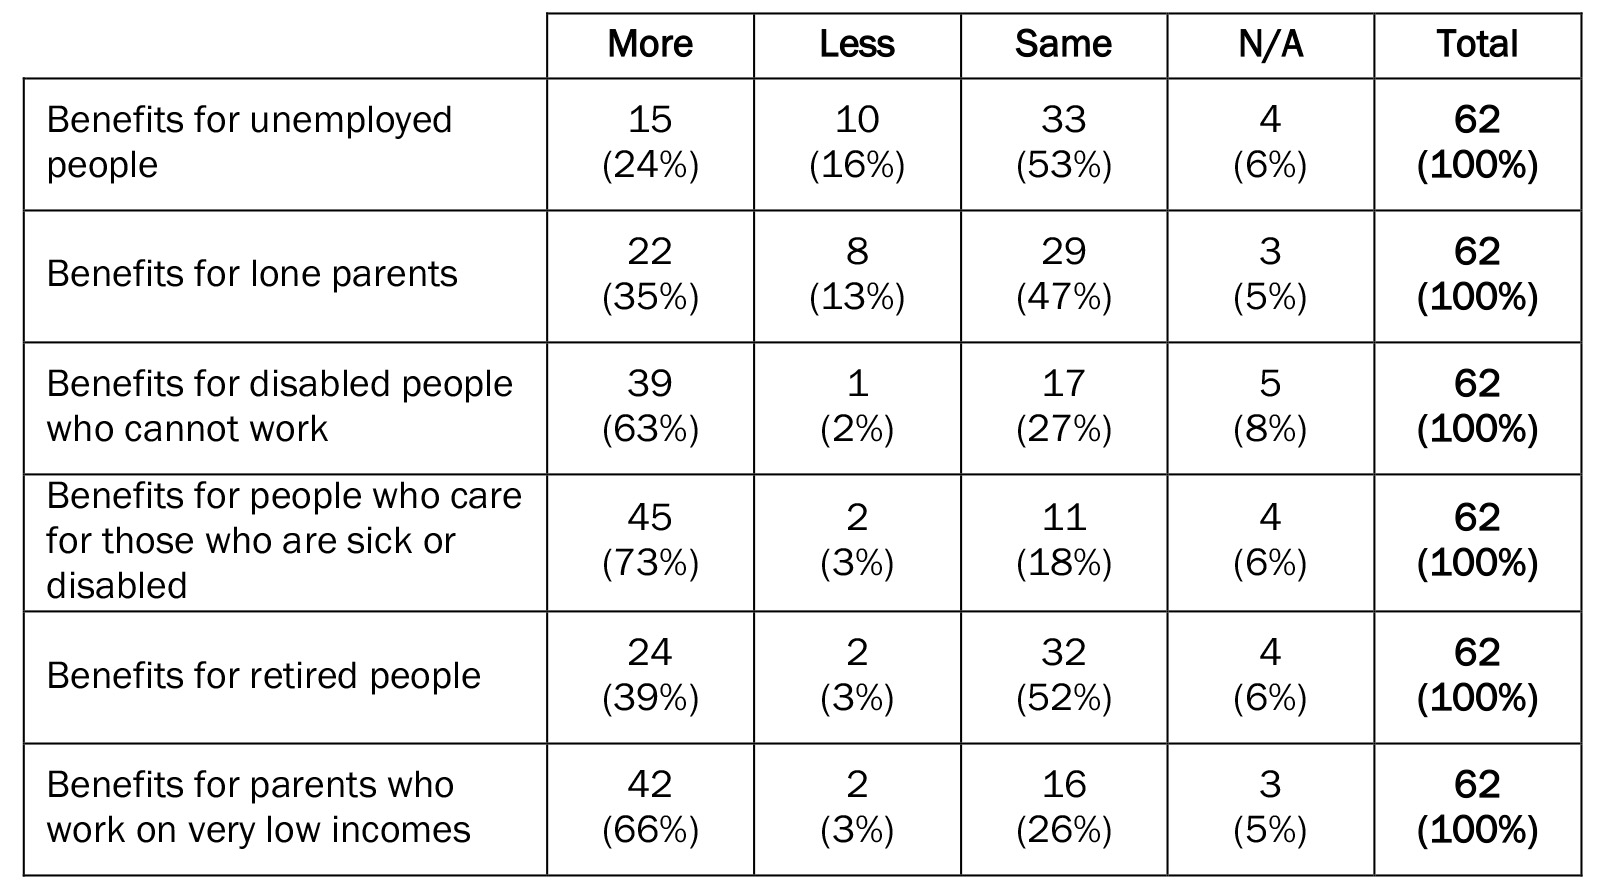
Although the response to the general question about whether more money should be spent on benefits showed a fairly even split (Table 2), when the question was applied to different categories of claimant, a higher proportion of respondents felt that in each case more should be spent on benefits than less. There was, however, a clear hierarchy in the priorities for more expenditure. Carers of people with disability, people working on low incomes and people with disability who cannot work all secured majority support for more expenditure. This is a similar pattern to that revealed in the BSA surveys. In the 2013 BSA survey, 73 per cent of respondents said they would like to see more government spending on benefits for those who are sick and disabled, 59 per cent on people who work on very low incomes and 54 per cent on disabled people who cannot work.
By contrast, only a minority of respondents thought there was a case for more expenditure on benefits for retired people, lone parents and unemployed people. A smaller proportion in the Sheffield survey than in the 2013 BSA survey thought more should be spent on retired people (39 per cent compared to 48 per cent) possibly reflecting the growing realisation that the cuts have been targeted at working-age claimants and that the ‘triple lock’ has more than preserved the real value of the state pension.1 A higher proportion of respondents in the Sheffield survey than in the BSA 2013 survey felt that more should be spent on unemployed people (24 per cent compared to 15 per cent), reflecting the general pattern of less ‘punitive’ views towards the level of benefits for unemployed people in the Sheffield sample.
Sixteen per cent of Sheffield respondents felt there should be less money spent on unemployed people and 13 per cent on lone parents; the proportions were negligible for spending less on the other groups. This again reflects the pattern of responses in the 2013 BSA survey, apart from the fact that a much higher proportion of respondents (49 per cent) felt that less should be spent on unemployed people.
Table 5 repeats a question in the BSA surveys on the extent of poverty, showing that 71 per cent of respondents in the Sheffield sample thought there was ‘quite a lot’ of poverty in Britain today. This compares with 62 per cent in the 2013 BSA survey (a figure which had increased from 54 per cent in 2006).
Table 5: Extent of Poverty in Britain

Overall the responses show that there is a greater awareness of poverty and a more ‘pro-welfare’ attitude among the Sheffield respondents than in the BSA surveys. That said, the broad priorities for spending elicited by the Sheffield respondents followed a similar pattern to that revealed in the national BSA surveys. We were interested to consider how far these attitudes were founded on realistic assessments of the level of expenditure on different benefits, and on the differential impact of cutbacks on benefits, or whether they were based on inaccurate perceptions, and this is the focus of the next section.
Knowledge of welfare benefits expenditure
The Government has made it clear that it wishes to promote greater public awareness about patterns of public expenditure and to this end it has recently distributed to taxpayers a summary breakdown of departmental expenditure. The Office for Budget Responsibility (OBR) has also published a detailed account of recent and future patterns in welfare expenditure in a report called Welfare Trends (OBR, 2014). It is obviously a complex task for anyone to keep track of expenditure patterns and trends, and different forms of calculation can be used in aggregating expenditure as well as distinguishing between the current and expected future impacts of cutbacks in different parts of the welfare benefits system. It was made clear to the respondents in the Sheffield sample that they were not expected to have a detailed understanding of such information. Instead, the questions were concerned to assess where people thought that money was being spent and the extent to which the level of expenditure on different benefits was being reduced. In the following Tables the correct response to each question is shown in bold text.
Table 6: What proportion of total government expenditure (GDP) is devoted to welfare spending including pensions?
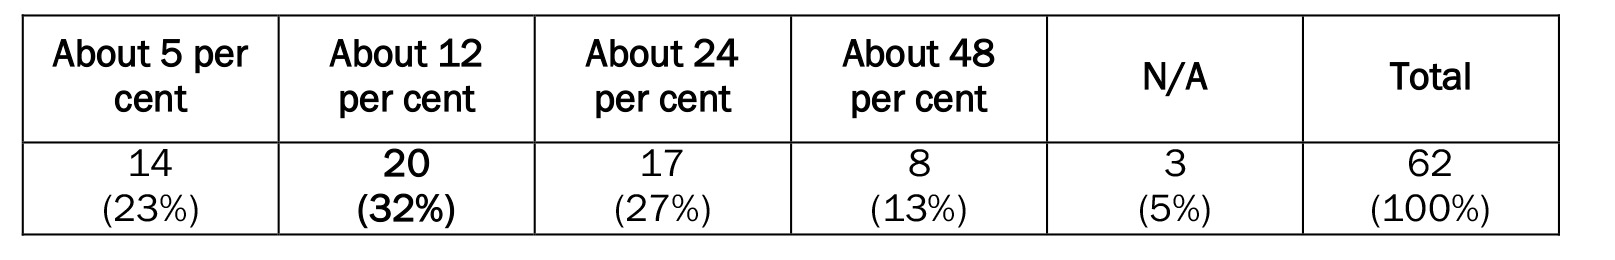
The proportion of Government expenditure on the welfare bill including the state pension is around 12 per cent of total expenditure,2 the answer given by 32 per cent of respondents. Just under a quarter of respondents thought it was less than half this proportion, while 27 per cent thought it was twice this proportion. Thirteen per cent of respondents felt that nearly half of government expenditure, four times the actual proportion, was devoted to benefits and pensions.
Over half of respondents (Table 7) thought that the state pension constituted a third or less of the total DWP benefits bill. In fact, it accounts for nearly half (48 per cent) of DWP benefits expenditure.3 Fifteen per cent answered this question correctly, while a further 15 per cent thought it constituted more than this, at two thirds of the budget. Table 3 had indicated that 39 per cent of respondents in Sheffield thought more should be spent on benefits for retired people – a smaller proportion than on benefits for people with disabilities and their carers or for working people on low incomes. These results showed that in many cases these respondents had in fact underestimated the proportion of the DWP budget currently taken up by the state pension. An awareness of the correct percentage may have reduced support still further for more expenditure on pensions.
Table 7: What proportion of the total DWP benefits bill is taken up by the state pension?
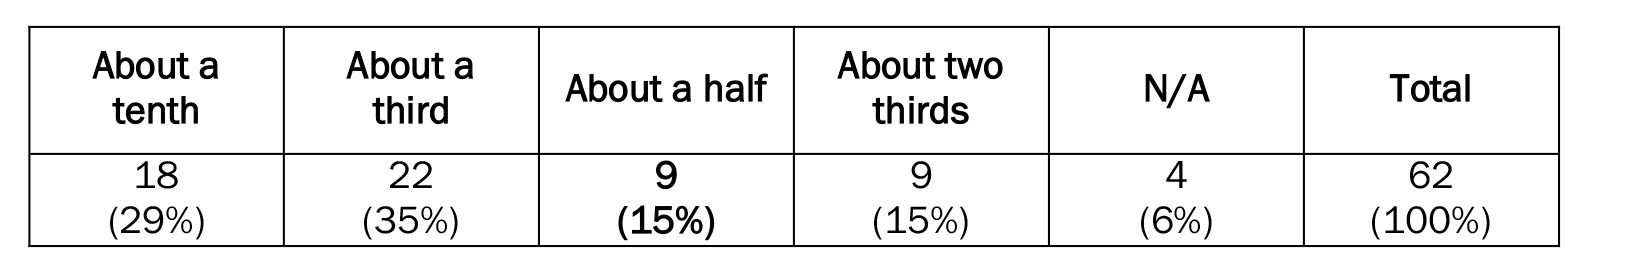
Table 8 shows that 42 per cent of respondents correctly identified that most money was spent on Housing Benefit from the list of benefits shown in the questionnaire. No respondents identified Disability Benefit, which is the second largest item of expenditure. It would perhaps be understandable if many people were not familiar with the differences between this and Incapacity Benefit (IB), but only six per cent mentioned IB in any case. The level of support for more spending on support for disabled people and their carers might be partly premised on a lack of awareness of the current level of expenditure. Around 40 per cent of respondents mentioned either Income Support or Jobseeker’s Allowance as the highest items of expenditure, although spending on these benefits is considerably lower than on the others.
Table 8: Which of the following benefits is most government money spent on each year?
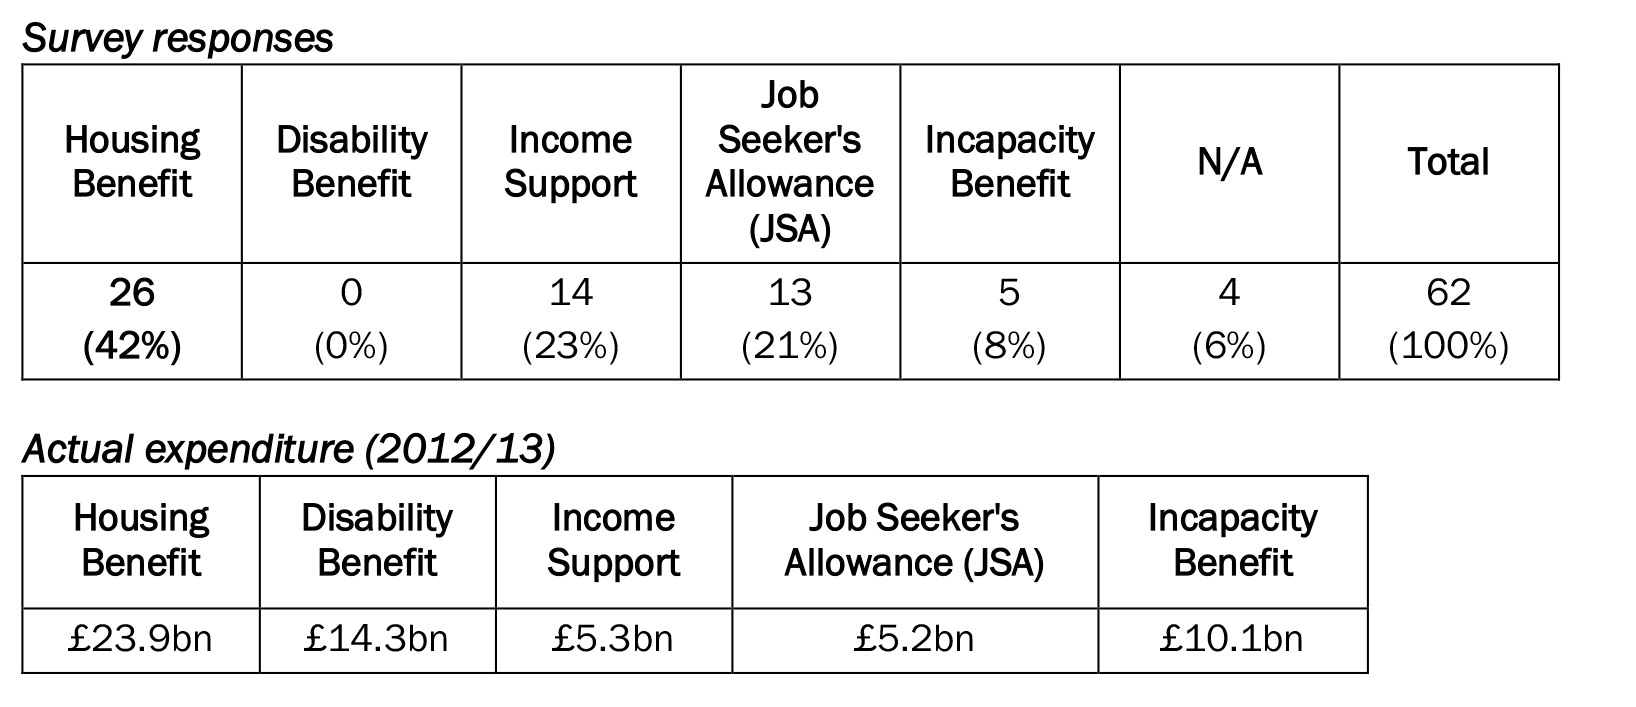
Table 9 shows that over a quarter of respondents mentioned Disability Benefit as the benefit where the least money is spent, although it is the second highest level of expenditure from the list of benefits provided. Twenty seven per cent of respondents correctly identified JSA as the benefit where least money is spent.
Table 9: Which of the following benefits is least government money spent on each year?
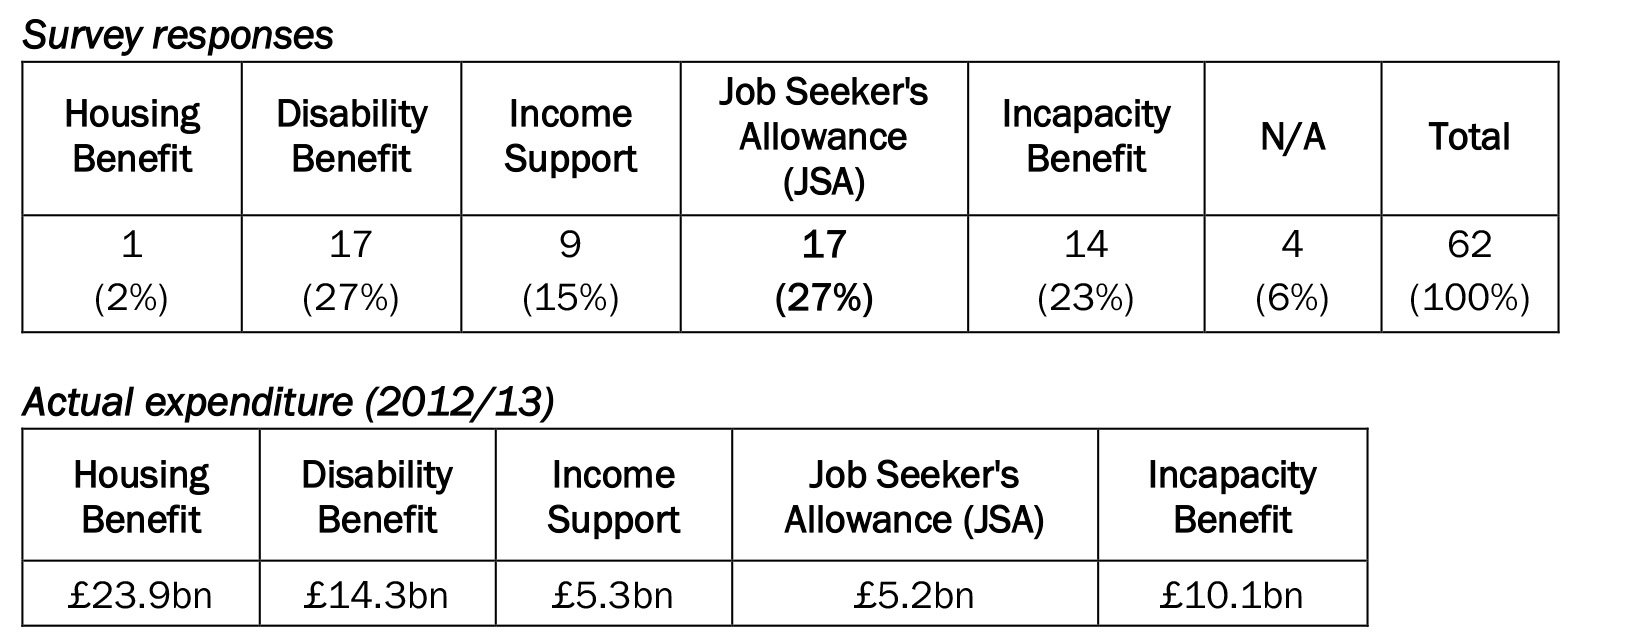
Table 10 sought to capture where the cutbacks have had the most impact – in absolute (total estimated annual savings) rather than relative terms (the proportion of the overall budget for the benefit). A distinction was made here between the reductions in Housing Benefit in the private sector and the social rented sectors. It enabled the analysis to consider whether the relatively high level of publicity over the controversial introduction of the Removal of the Spare Room Subsidy (or ‘bedroom tax’) had affected public awareness of the extent of the cutbacks that had been made.
Table 10: Where has the government made the most savings since 2012?
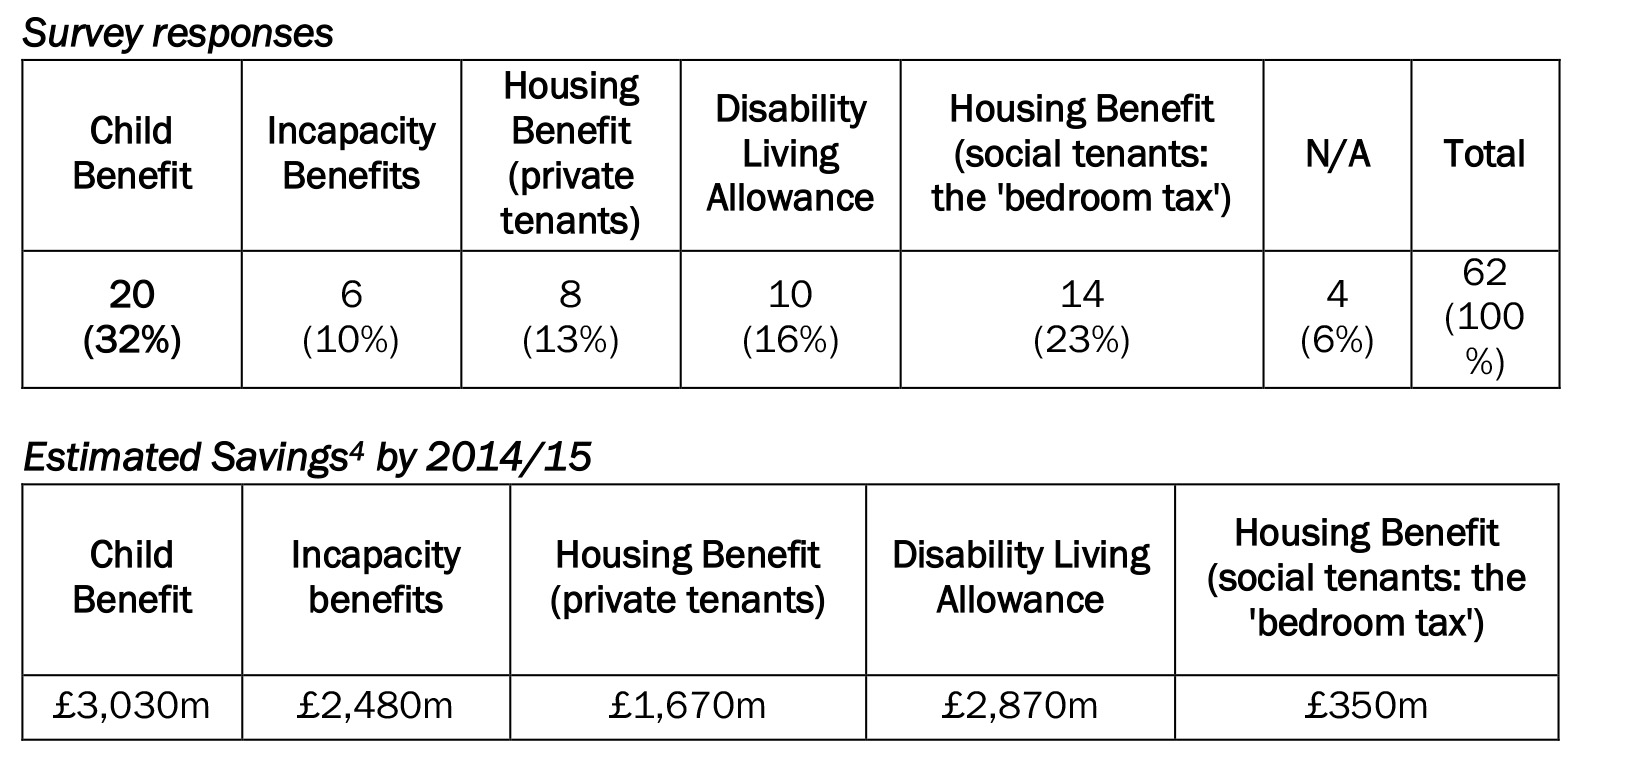
Nearly a third of respondents correctly identified Child Benefit as the area where expenditure has been cut back the most. However, only 16 per cent of respondents mentioned Disability Living Allowance as the benefit with where the most savings have been made, even though the scale of the annual reductions in this benefit is close to that of Child Benefit. Nearly a quarter of respondents selected the ‘bedroom tax’, but the estimated annual reductions here are far lower (£350 million) than for the other benefits in the list.
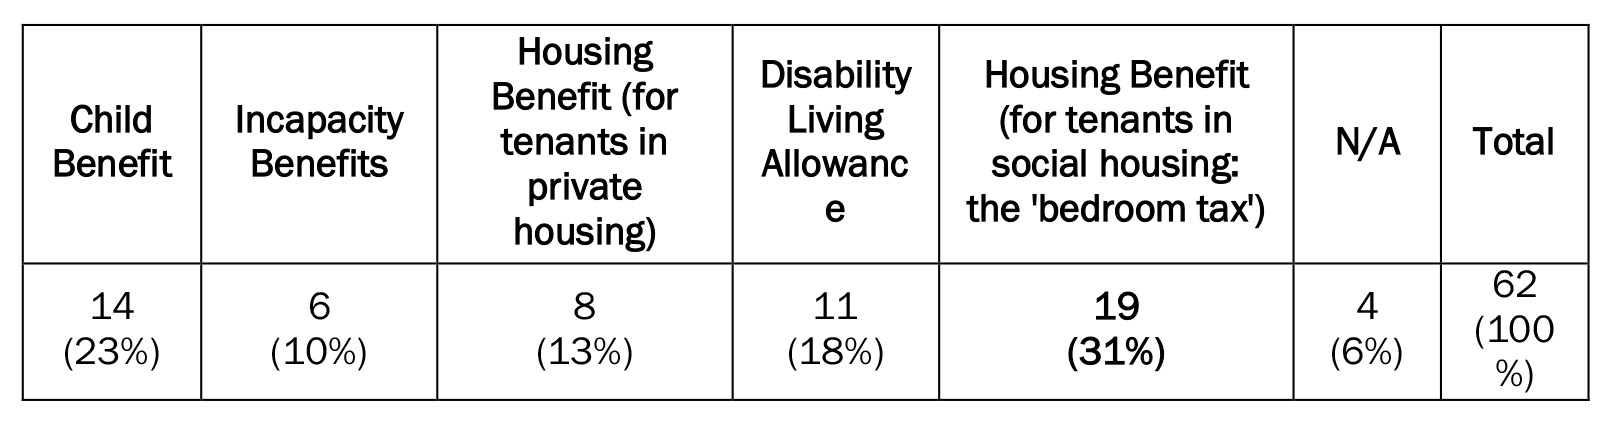
Table 11 presents the perceptions of where the least savings have been made. Thirty one per cent correctly identified the ‘bedroom tax’. Nearly a quarter mentioned Child Benefit, although this was, as seen above, the benefit where the highest reductions have actually been made.
Table 11: Where has the Government made least savings since 2012?
The relationship between attitudes towards and knowledge about benefits expenditure
This section considers how attitudes towards benefit spending and knowledge of the welfare system are influenced by respondents’ self-assigned financial status, and assesses the composite responses set out earlier in the paper. Three rudimentary indices were devised, based on scoring the responses in a specific way. The paper then examines how scores differed between those respondents who were relatively positive about welfare expenditure and benefit claimants, compared to those who were more negative, and between those who were relatively well informed about trends in expenditure and those who were less informed.
Responses to the attitudinal questions in the first part of the questionnaire were scored according to whether they were largely in favour of the level of benefits spending and had relatively positive views about claimant behaviour and the ‘culture’ of claiming, or whether they wanted less spending on benefits and were more negative about claimant behaviour. These were rather crudely categorised as ‘pro-welfare ‘and ‘anti-welfare’. Clearly, the scores should only be taken as a general guide to overall attitudes; the salience of each response has been treated as identical and there is little scope for nuanced or qualified answers to pre-defined statements. The attitude scores ranged from -9 to +32. Twenty three responses scored between 16 and 32 and this group was classed as ‘strongly pro-welfare’. 28 responses were scored between 1 and 15 and this group was classed as ‘fairly pro-welfare’. Eight responses overall were scored between -9 and 0 and this group was classed as ‘anti-welfare’. There were three non-responses. Table 12 shows how scores varied by self-assigned financial status.
For the second part of the questionnaire, on knowledge of benefits expenditure, respondents were scored two points if they had the right answer and one point if their answer was in an adjacent category to the correct response. The only exception was in the question shown in Table 9, where respondents scored two for either JSA or Income Support, as the level of expenditure on these two benefits was virtually the same in 2012/13. Scores among the respondents ranged from 1 to 15. Those who scored between 0 and 6 (14 responses) were classed as ‘not informed’, the 32 respondents who scored between 7 and 9 were scored as ‘fairly informed’ and the 13 responses from those who scored over 9 were classed as ‘well informed’. The distribution of responses by self-assigned financial position is also shown in Table 12.
Table 12: Attitudes towards, and knowledge of, benefits spending by self-assigned financial status
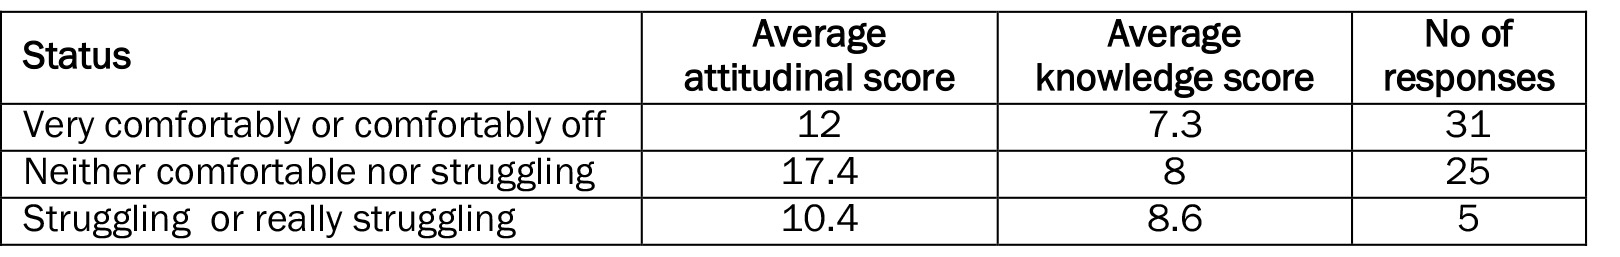
Any interpretation of the responses of those who say they are ‘struggling’ in Table 12 needs to be treated with even more caution than responses elsewhere, given that only five respondents fell into that category. That said, the attitudes of these respondents tended to be less positive about benefit spending than in the other two groups, partly because their responses tended to be negative about the perceived extent of cheating that takes place in the system. In the other two groups, those who classified themselves as ‘neither comfortable nor struggling’ were more positive on the whole about welfare than those who classed themselves as ‘comfortably off’.
Knowledge about benefits expenditure was higher among the five respondents who classed themselves as ‘struggling’ than it was for those who were ‘comfortably off’. There is not enough background information about the respondents to indicate how much this is related to having more experience of receiving benefits, but it is one possible factor behind such differences.
Table 13: Attitudes to welfare and knowledge of benefits expenditure
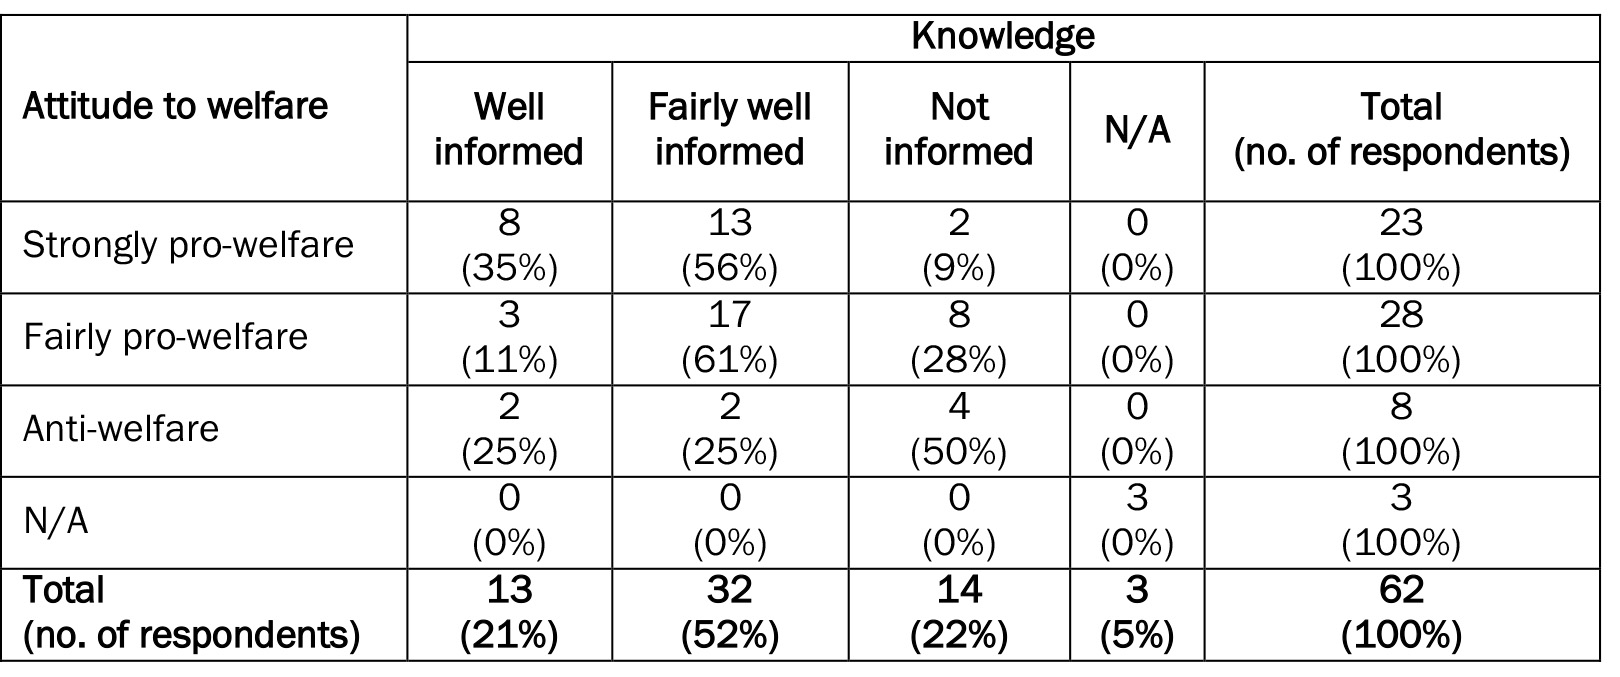
The sample sizes in Table 13 are very small, so the results are far from robust. However, Table 13 shows that while eight out of 13 of those respondents who were classed as ‘well informed’ were ‘strongly pro-welfare’, only two of this group (15 per cent) was classed as ‘anti-welfare’. Only two out of the 23 respondents (nine per cent) in the ‘strongly pro-welfare’ group were classed as ‘not informed’, compared to four of the eight (50 per cent) of the ‘anti-welfare’ group.
A different way of expressing these differences is to examine average scores among all respondents in the different categories. The average ‘knowledge’ scores among the ‘strongly pro-welfare’ group was 9, compared to 7.75 for the ‘fairly pro-welfare’ group and 6.75 for the ‘anti-welfare’ group. Similarly, the average attitudinal scores for the ‘well informed’ group of respondents was 17.5, which was more positive about welfare then the ‘fairly well informed’ group (average score of 14.4) and markedly more ‘pro-welfare’ than the ‘not informed’ group (average score of 6.8).
A revised count of respondents’ knowledge of the questions in the second half of the questionnaire was undertaken, focusing on core questions about overall expenditure. The core questions concerned the overall proportion of GDP spent on benefits, the proportion taken up by the state pension, and the benefits where least money was spent and where most money was spent. Scores varied between 0 and 8. A similar relationship emerged. The average score for those 16 respondents with more accurate answers to these four questions (scoring over 4) was higher, and hence more ‘pro-welfare’, at 15.2. Those respondents with the least accurate answers (scoring under 4) had an average attitudinal score of 11.4, reflecting more negative attitudes to welfare.
The results tentatively suggest that there may be a relationship in the direction of better informed respondents taking a more positive attitude towards welfare expenditure and claimant behaviour than their less well-informed counterparts. Similarly, those with the most positive views towards benefit expenditure and claimant behaviour are on average more knowledgeable about the welfare system than those who are negative about it. This implies that the relentless stream of ‘poverty porn’ (Jensen, 2014) in the media and the practice of agnotology (Slater, 2012) can produce a misleading picture of the welfare system and may generate harsher attitudes towards benefit claimants and benefits expenditure as a result.
Conclusion
The results of the Sheffield survey do not lend themselves to a wholly straightforward narrative about public attitudes towards, and knowledge of, expenditure on welfare benefits. While the trend suggests that those who are more knowledgeable about patterns of expenditure tend to take a more positive view toward spending on benefits and the perceived behaviour of claimants, it is beyond the scope of this exercise to identify with any confidence the key factors that may lie behind this relationship. There may be a ‘Sheffield effect’ in these responses, and it would be necessary to undertake this kind of exercise in other locations to assess this. One might speculate that attitudes towards unemployed people would be less positive in more affluent areas, given the finding here (echoed in the BSA survey) that people who define themselves as ‘comfortably off’ have less positive attitudes overall to welfare expenditure.
In summary, the majority of respondents in the Sheffield survey disagreed with the statements that ‘many people who get social security do not really deserve any help’ and ‘most people on the dole are fiddling in one way or another’. The majority also felt that there should be more expenditure than at present on benefits for disabled people who cannot work, for people who care for those who are sick and disabled and for people who work on very low incomes. Furthermore nearly three quarters of those interviewed thought that ‘there was quite a lot of real poverty in Britain’. However, opinion was more evenly divided on other questions – notably whether the government should spend more money on welfare benefits even if it leads to higher taxes (44 per cent in favour, 42 per cent against) and whether benefits for unemployed people are too low (47 per cent agree) or too high (44 per cent agree).
There were some questions where the balance of public perceptions diverged considerably from factual information about benefits expenditure. For example, nearly two thirds thought that the state pension constituted a third or less of the total DWP bill, when the actual proportion is nearer to a half and no respondent identified Disability Benefit as the item of largest expenditure from a selected list, when it constituted the second largest item. On other questions perceptions were closer to actual trends – such as the proportion of GDP taken up by welfare benefits, and the fact that expenditure on Housing Benefit is higher than on other benefits, excluding the state pension.
It is difficult to distil these findings into a clear message for the political debates over benefits expenditure and the welfare state. But the Sheffield survey does suggest that shining a light on how ‘taxpayers’ money’ is spent may not necessarily increase support for further cuts in the welfare budget. Indeed, the reverse is more likely to be the case, though much is likely to depend on how the figures are presented. On the basis of this survey, there is only limited public support for continuing to exempt pensions and ancillary benefits for retired people from any future reductions in expenditure. However any intentions about fairness and ‘being in it together’ have been thwarted by the realpolitik of the greater propensity of the over 65s to vote compared to younger age cohorts.5
This paper was completed on the first day of the formal general election campaign. The need for further cuts in spending on benefits for working-age people (amounting to £12 billion, of which only £2 billion have so far been specified) is being promoted relentlessly by the Conservatives. The Labour Party seems determined to respond by changing the subject, to the NHS, rather than setting out an alternative agenda on welfare benefits, with the single exception of the commitment to scrap the bedroom tax (shared also by the Greens, Plaid Cymru, SNP and UKIP). But this ‘straw poll’ in Sheffield city centre provides some food for thought in that public attitudes may be more nuanced and complicated than often assumed.
To adopt the widely misquoted version of Alexander Pope’s aphorism that ‘a little learning is a dangerous thing’, a little knowledge about welfare and spending may indeed be a ‘dangerous thing’. But a little more knowledge about benefit spending might make it slightly more difficult for critics to draw on the regular stereotypes that haunt the ‘welfare debate’ – those apparently ubiquitous sofa lolling, cheating and workshy benefit claimants. A few more hard facts could be given instead about trends in expenditure, and the balance of spending between different benefits and different groups of claimant. It is no doubt utterly naïve to suggest that the current skirmishes over welfare should be tempered by stronger commitment to empirical accuracy, to cool down heated pre-election tropes denigrating working-age claimants. But, if agnotology prevails, the likely future scenario for working-age claimants seems bleak indeed – receiving benefits that decline in real value year-on-year, to which access is increasingly restrictive and conditional. This is the emerging world of welfare, where demanding behavioural rectitude through punitive measures will continue to take precedence as a policy objective over mitigating the human and social costs of living in poverty.
1 It should also be noted that the proportion in the BSA surveys that support more expenditure for retired people has fallen from 72 per cent in 2008 to 57 per cent in 2011 to 48 per cent in 2013.
2 Total welfare spending for 2013/14 forecast at 12.6 per cent of GDP (OBR, 2014, Table 3).
3 £79.8 billion out of £165.5 billion in 2012/13 (OBR, 2014, Table 2.1)
4 Source: Beatty and Fothergill (2013) including (unpublished) subsequent revisions made by the authors in early 2015, due to changes in the official estimates and impact assessments.
4 Source: Beatty and Fothergill (2013) including (unpublished) subsequent revisions made by the authors in early 2015, due to changes in the official estimates and impact assessments.
5 According to the British Election Study, three-quarters of people aged 65+ (75 per cent) turned out to vote in 2010, compared with just over half (52 per cent) of those aged 18-24. – It is thought that the proportion of younger people voting will decline further in 2015.
I would like to thank Elaine Batty, Rich Crisp, Steve Green, Paul Hickman and Ryan Powell for their comments on a draft of this paper and for help in planning and undertaking this survey. Many thanks to Christina Beatty for making available updated figures on the annual reductions in benefits expenditure. Many thanks to Jessica Bamonte, Emma Smith and Elaine Batty for their energetic and persuasive recruitment of participants for the survey, and for their contribution to subsequent discussions with respondents.
Professor Ian Cole, CRESR, Sheffield Hallam University, Unit 10, Science Park, Howard Street, Sheffield, S1 1WB. Email: i.d.cole@shu.ac.uk
Beatty, C., Cole, I., Powell, R., Kemp, P., Brewer, M., Browne, J., Emmerson, C., Hood, A. and Joyce, R. (2014) The Impact of Recent Reforms to Local Housing Allowances: Summary of key findings. DWP Research Report No. 874. London: DWP.
Beatty, C. and Fothergill, S. (2013) Hitting Poorest Places Hardest. Sheffield: CRESR, Sheffield Hallam University. http://www.shu.ac.uk/research/cresr/sites/shu.ac.uk/files/hitting-poorest-places-hardest_0.pdf
British Social Attitudes 31 (2014) http://www.bsa.natcen.ac.uk/latest-report/british-social-attitudes-31/key-findings/britain-2014.aspx
DWP (2006) A New Deal for Welfare: empowering people to work – cm 6730. London: DWP. https://www.gov.uk/government/uploads/system/uploads/attachment_data/file/272235/6730.pdf
DWP (2008) Raising Expectations and Increasing Support: reforming welfare for the future cm7506. London: DWP. https://www.gov.uk/government/uploads/system/uploads/attachment_data/file/238683/7506.pdf
DWP (2010a) 21st Century Welfare – cm 7913. London: DWP. https://www.gov.uk/government/uploads/system/uploads/attachment_data/file/181139/21st-century-welfare_1_.pdf
DWP (2010b) Universal credit: welfare that works – cm 7957. London: DWP. https://www.gov.uk/government/uploads/system/uploads/attachment_data/file/48897/universal-credit-full-document.pdfaptiured
Freud, D. (2007) Reducing Dependency, Increasing Opportunity: options for the future of welfare to work. London: DWP. https://www.remploy.co.uk/files/freud-report-2007.pdf
Hills, J. (2014) Good Times, Bad Times. The Welfare Myth of Them and Us. Bristol: Policy Press.
Jensen, T. (2014) Welfare Commonsense, Poverty Porn and Doxosophy. Sociological Research Online, 19, 3, 3. CrossRef link
Macdonald, R., Shildrick, T. and Furlong, A. (2014) ’Benefits Street’ and the Myth of Workless Communities. Sociological Research Online, 19, 3, 1. CrossRef link
Office for Budget Responsibility (2014) Welfare Trends. London: OBR.
Pykett, J. (2014) Representing Attitudes to Welfare Dependency: Relational Geographies of Welfare. Sociological Research Online, 19, 3, 23. CrossRef link
Slater, T. (2012) ‘The myth of ‘Broken Britain’: Welfare reform and the Production of Ignorance. Antipode, 46, 4, 948-969. CrossRef link
Tyler, I. (2013) Revolting subjects: social abjection and resistance in Neoliberal Britain. London: Zed Books.
Wilcox, S. (2014) Housing Benefit Size Criteria: Impacts for Social Sector Tenants and Options for Reform. York: Joseph Rowntree Foundation.