Abstract
Developments in the youth labour market are regularly framed as successful by the UK Government who argue that young people have a growing and vibrant jobs market. Sociological discourse has tended to focus on the growth in precarious work and the substantial decrease in the availability of employment for young people. Far less attention has been paid to the parallel issue of whether these changes are associated with shifts in occupational level. Yet occupational position remains one of the most powerful general indicators of life chances, social and material reward and status available. To examine how the occupational position of young people in the UK may have altered, this article focusses on two periods either side of the Great Recession (2005-7 and 2015-17). We find there has been a reduction in regional inequality in the level of jobs young men and women are doing. For young men, there has been a disproportionate loss of less advantaged occupations, raising the average occupational position in a number of regions. For women, the opposite trend has occurred; there has been a disproportionate loss of more advantaged occupations, leading to a general drop in the average advantage level.
Introduction
Sociological analysis of the youth labour market has focussed on its long-run loss of jobs (e.g. MacDonald et al., 2005; Crisp and Powell, 2017) and the growth of ‘precarity’ (e.g. Standing, 2011; Antonucci, 2018). Far less attention has been paid to the parallel issue of occupational position and whether there have been measurable shifts in the relative advantage of youth work. The research presented below is situated in this substantial gap in the international literature. The aim of the article is to compare the occupational position of young people before the Great Recession of 2008, with their situation ten years later. Occupational advantage is an ongoing sociological concern. Sociology has built evidence that occupation is amongst the most powerful general indicators of life chances, social and material reward and status, available (Connelly et al., 2016a).
The UK youth labour market seems to be defined by constant change. Long-run developments such as labour market deregulation, deindustrialisation and the expansion of higher education have intersected with the Great Recession of 2008 to exacerbate uncertain, complex and non-linear trajectories-to-work for many young people (Crisp and Powell, 2017: 1785). The UK saw a period of limited economic growth and increased economic insecurity after the 2008 recession (Junankar, 2015; Bell and Blanchflower, 2011). The recession led to an increased probability of unemployment (Bell and Blanchflower, 2011) and adverse individual mental health (Strandh et al, 2014). By 2011, over one million young people were unemployed (ONS, 2011: 10) – 21.7 per cent of all young people. This impacted all groups – even those not usually associated with labour market insecurity – as one in five graduates also became unemployed (Office for National Statistics, 2011; MacDonald, 2011; Formby, 2014; Formby, 2017). In the ten years since the Great Recession, young people have continued to experience substantial difficulties in the labour market. They have seen a reduction in take-home pay of 12.5 per cent since 2009 (Whittaker, 2015) and, more than any other age group, they have experienced decreased wages over this period (Hills et al., 2015: 1).
The UK labour market as a whole is shaped by inequality. Young people in urban and post-industrial contexts have been disproportionately impacted by declining economic opportunities (MacDonald et al., 2005; Crisp and Powell, 2017). Ten years on from the Great Recession and the UK youth unemployment rate has fallen to 12.2 per cent (February 2020-April 2020) and this is low in comparison to recent years (Foley, 2020: 2). Yet, this is still considerably higher than the national UK unemployment rate at 3.9 per cent in 2020 and only slightly below the EU average of youth unemployment at 14 per cent (Foley, 2020: 7). The spatially and demographically unequal nature of unemployment is summed up by Crowley and Cominetti (2014: 1) who have commented: “the recovery is leaving young people, and some places, behind. The labour market has, on the surface, improved… Yet to an extent this improvement has been superficial.”
The current article uses the Labour Force Survey to undertake an analysis that compares the youth labour market between periods before and after the Great Recession (2005-07 and 2015-17). This is a direct attempt to “account for historical change and its impact on the power relations in which young people are enmeshed, while also being sensitive to spatial difference” (Crisp and Powell, 2017: 1804). To enhance sociological understanding of how the youth labour market has changed (and is changing), the analysis also compares the occupational position of young people incorporating a spatial, regional approach. This brings to the fore regional inequalities and gendered patterns in the changing occupational position of young people (Ralston et al., 2016). The elimination of young people from occupations that had previously employed them is emphasised as an underlying issue affecting changes shown. Overall, the analysis challenges governmental claims of a ‘successful’ and ‘thriving’ youth labour market through showing the extent of what has been lost since the Great Recession of 2008-09. Echoing Crowley and Cominetti (2014), the findings indicate that any recent improvement in the position of young people has been ‘superficial’.
Literature Review – The Landscape of the UK Youth Labour Market
Furlong and Cartmel (2007: 2) argue that the youth labour market is an area that sits “at the crossroads of social reproduction”. By understanding what is happening to employment opportunities and young people, we can be far more informed on how the wider economy may be changing (MacDonald and Giazitzoglu, 2019) and how different groups may be affected by such change. MacDonald argues:
“The youth phase allows a privileged vantage point from which to observe broader processes of social change and, as such, to answer questions of wider relevance for sociology. If new social trends emerge it is feasible that they will be seen here first or most obviously, among the coming, new generation of young adults” (MacDonald, 2011: 428).
Historical structural changes have fundamentally re-shaped of the youth labour market across decades. Recent increases in numbers of young people entering higher education, as well as an increase in the state education leaving age (up to 18 in England and Wales) typifies this constant change to the education-to-work period. In the UK, 50,000 people obtained a first degree in 1970, increasing to 400,000 in 2017 (Hillage, 2018). Before higher education “became the new default option for Britain’s young people” (Roberts, 2013: 4), previous young people’s education-to-work transitions were characterised by far quicker entry into the labour market – notwithstanding times of recession (Roberts, 2013: 2). Yet, many of the entry-level positions young people had traditionally taken up started to disappear by the late 1970s. Coles notes “the economic recession during the latter half of the 1970s and the early 1980s all but destroyed this simple, predominant, and one step transition from school to work”, and despite the subsequent economic ebb and flow, “the youth labour market as it existed in the 1970s has not re-emerged” (Coles, 1995: 35). Over the subsequent decades, young people have increasingly vanished from the labour market (Roberts, 2013), as entry-level positions decreased in quality and quantity. This continues to the case in the contemporary youth labour market. For many young people, public and service sector employment became the dominant entry-route into work as former industrial positions declined over the 1980s, 1990s and 2000s (Papoutsaki et al., 2019: 22). The prevalence of these positions in the youth labour market prompted concerns of repeated ‘low-pay, no-pay cycles’ leading to “broader experiences of disadvantage” over the life-course through the lack of sustainable career options (Shildrick et al., 2010: 1).
Normalisation of de-standardised forms of employment within the youth labour market parallels their expansion within the wider economy (MacDonald and Giazitzoglu, 2019). This growth in precarity has been a major sociological trend (Standing, 2011; Antonucci, 2018). These forms of employment arrangement include: temporary working, zero-hour contracts, varying forms of underemployment (e.g. under-utility of skill and under-utility of labour e.g. a lack of working hours), and unpaid internships. In an analysis across 2010-2019, the TUC (2017: 12) noted there were 3.2 million insecure workers in the UK, including people employed on zero-hour contracts, temporary work, casualised and seasonal work as well as low-paid self-employed workers, with young people in many such positions. Gregg and Gardiner (2015) found that up to 50 per cent of 18-29-year-olds were in insecure labour market positions in 2014 – an increase of 40 per cent from 1994. Roberts (2009) argued that global underemployment was a normative aspect of the youth labour market experience throughout the 2000s – as governmental focus on creating broader conditions for ‘flexible’ work meant initial youth interactions with the job-market were often insecure, fleeting and unsupportive in terms of broader life trajectory.
When the economy experiences recession job opportunities tend to tighten even further. Watson (2020) compared pre-and-post 2008 recession periods in the Australian youth labour market and found “the post-GFC cohort fared much worse in the labour market than did the pre-GFC cohort” (Watson, 2020: 51). In particular, analysis points to a collapse in full-time employment for both young men and women – with no substantial rebound following the recession (Watson, 2020: 33). There has been a similar pattern in the UK where long-term reductions in employment opportunities have impacted young people considerably. As Roberts argues, “there is an overall shortage of jobs, not least good jobs” (Roberts, 2009: 365). This is specifically concerning for non-graduates (already experiencing a decline in demand in the types of jobs they would normally do). Jobs that were left became “increasingly contested by older and more experienced workers” (UKCES, 2014: 8). Throughout the recovery (post-2009), declining employment in key sectors, such as sales and customer service occupations (retail sector) and elementary occupations (includes many jobs in hospitality) has further compounded these issues. In 2013, these types of occupations accounted for over half of all youth employment. Yet the evidence shows young people were squeezed out of the types of occupation that would have previously employed them (Ortiz and Cummins 2012). Where there has been growth this has mostly occurred in the technical and professional sectors, benefitting experienced and skilled workers more than other groups (UKCES, 2014: 8).
The structural changes outlined above intersect with social divisions of youth and play out unequally among different groups. Structures of class and gender along with spatiality/place shape how young people experience job-entry in the current UK labour market (MacDowell, 2012). Local and regional youth labour markets vary in the extent of job opportunity available. Crowley and Cominetti (2014: 3) argues: “there are large differences in youth unemployment levels within the UK which reflect a familiar pattern of labour market disadvantage”, especially for those that have “experienced economic distress for some time and have failed to adjust to the changing geography of the UK’s economy”. Often, youth policy is framed as an urban rather than rural issue as youth unemployment tends to be higher in urban contexts (Crisp and Powell, 2017), yet each youth labour market has specific challenges that are local to that geographical context e.g. young people moving away from coastal towns due to a lack of work (Reid and Westergaard, 2017). Indeed, variation in the marginalisation of groups of young people in different parts of the UK has long-been established in youth transitions research (MacDonald et al., 2001; MacDonald et al., 2005; MacDowell, 2012; Shildrick et al., 2012). Understanding the UK youth labour market necessitates analysis that involves comprehending which groups of young people are most subject to occupational disadvantage – especially in terms of historical and regional context. MacDowell (2012: 587) makes an explicit argument about the vulnerability of young people whom without “the advantages of class privilege or educational success find themselves embedded in sets of economic and social circumstances that make them unsuitable workers in the ‘knowledge’ economy’” (MacDowell, 2012: 587). For young people in this situation, engaging with a limited local labour market may be one of the only choices they have.
The response of Government to the problems faced by young people has been to emphasise a thriving and successful UK youth labour market. Even developments that indicate the relative economic insecurity of young people, such as the rise of the ‘gig economy’, have been framed in positive and ‘entrepreneurial’ terms by Government Ministers (MacDonald and Giazitzoglu, 2019). This is despite evidence that shows the problematic nature of non-standard forms of employment in undermining terms and conditions, and reducing the individual agency of workers (Woods, 2017). Moreover, policy responses to youth precarity and unemployment continue to be framed in terms of a ‘supply-side orthodoxy’ (McQuaid and Lindsay, 2005). Through such a reading, unemployment is explained by individual lack of skills and commitment with unemployment becoming part of the larger discourse of ‘worklessness’ (Pemberton et al., 2016; Shildrick et al., 2012). The argument here is that young people bear responsibility for their own personal ‘employability’. However, policy rooted to ‘supply-side orthodoxies’ fails to account for wider explanatory factors regarding youth unemployment e.g. constrained, local labour markets that may not offer young people sufficient employment opportunities (Crisp and Powell, 2017). The deeper implication here is that young people can individualise experiences of failure in their trajectories-to-work (Hardgrove et al., 2015: 1060) when it is a lack of opportunity in the youth labour market that holds many back.
Aims
MacDowell argues, young people’s “likelihood of not finding employment is significantly related to their possession (or lack) of skills, their gender and regional location” (MacDowell, 2012: 580). Our analysis takes these factors into account. As youth labour markets are shaped by local factors (MacDowell, 2012; Martin and Morrison, 2003) we provide cross-sectional comparison involving a spatial, regional dimension. Our models also account for the gendered nature of the youth labour market and controls for educational attainment levels. Watson (2020) performed sequence analysis to see “whether labour market outcomes differed between cohorts, and, by extension, between the periods before and after the global financial crisis” (Watson, 2020: 33). Taking a different approach, this article compares pre-and post-recessional periods to highlight change that has occurred following the Great Recession.
Guiding research questions are:
- Has the occupational position of the recent cohort of youth workers (2015-2017) shifted compared to the period prior to the Great Recession of 2008 (2005-2007)?
- Have there been changes in regional occupational patterns?
- Is there evidence of gendering to any changes in average occupational position?
Data and Methods
The analysis has been undertaken using the Labour Force Survey (LFS) quarterly datasets (Office for National Statistics, 2019). The LFS combines a cross-sectional and a short-run longitudinal design. The analyses here are from the pooled cross-sectional part of the survey, therefore only individuals recorded at their first measurement point were included. In order to match respective occupational positions, data on youth employment was pooled from the period leading up to the Great Recession of 2008 (2005-2007) and the period ten years later (2015-2017). This enables analysis of the occupational position of young people, comparing the period prior to the Great Recession with the period ten years later. This strategy makes possible assessment of change in occupational circumstance. The age range of the sample are 18 to 24 years old and the total number of these cases are n=40,637. The analysis was carried out on young people recorded as working full time only. This is n= 9,447 men, and n=7,609 women.
The analyses are split by gender. This is because life course trajectories, structures of decision making related to work and occupational outcomes vary between men and women (Blau et al., 2013). Regional change in occupational position of young people is also explored. The UK labour market is dissected by geographical cleavages with London and the South East disproportionately experiencing the greatest share of human and infrastructure resources (Duranton and Monastiriotis, 2002). For many decades this has helped to drive geographical inequalities in the UK labour market (Lee et al., 2013). Region is included in the analyses using the LFS variable recording region of usual residence. This comprises 20 regions (see Table 1).
Occupations are included using four-digit standard occupational groups – SOC2000 (Elias et al., 1999). There are 369 occupational groups at this level. These have been used to generate CAMSIS scores for both men and women (Prandy and Jones, 2001). CAMSIS is a measure of occupational position in the form of a scale of social distance and occupational advantage (Prandy and Lambert, 2003). More advantaged occupations score more highly on the scale, which ranges from 0 to 100 and is designed to have a mean of 50 for the general population. CAMSIS is used here as the outcome variable in describing and modelling the occupational position of young people (Lambert, 2012). Educational attainment level is also included in the analyses. Educational qualifications are intrinsic to transitions of young people into work and to the types of jobs they end up doing (Bynner and Parsons, 2002; Croll, 2009). The variable applied records the highest reported attainment level, from degree, higher education level, GCE/A-level or equivalent, GCSE A*-C level or equivalent, other qualifications, no qualifications and don’t know. Variation in education levels of the workforce could explain differences in occupational position. Controlling educational attainment level in modelling means that any observed variation in occupational position, between regions or over time, is not explained by a differential education level of the workforce.
Presentation of results begins with description of CAMSIS score by gender, comparing the periods 2005-2007 and 2015-2017 (Table 2). This is then expanded to also consider region (Table 3). Regression models of CAMSIS position are introduced which control for educational attainment age and time period (Tables 4 and 5). To facilitate comparison between time points and by region, region is interacted with a dummy variable separately specifying the periods 2005-2007 and 2015-2017. This estimates coefficients for the CAMSIS score, for each region, in each period. Predicted margins of the interaction are also estimated and included in graphs (Figures 1 and 2). The margins are estimated as conditional marginal effects (see, Connelly et al., 2016b). Results are presented unweighted but equivalent models applying individual person weights are reported in Appendix 1. Visualisations comparing regional labour markets are also given (Figures 3 to 6). It should be noted that the response rate to the LFS declines across the period of analysis and also, the later cohort is naturally smaller because of demographic change. This has an influence on the raw numbers of young people in each cohort (2005-2007, 10,158 – 60 per cent; 2015-2017, 6,898 – 40 per cent). This accounts for some of the sparseness in Figures showing differential numbers of young people in occupations by region between time points. The general trends in lower proportions of young people in work and in the type of occupations they are employed in are real however and not an artefact of demography or the declining response rate.
Table 1: Descriptive table of key variables
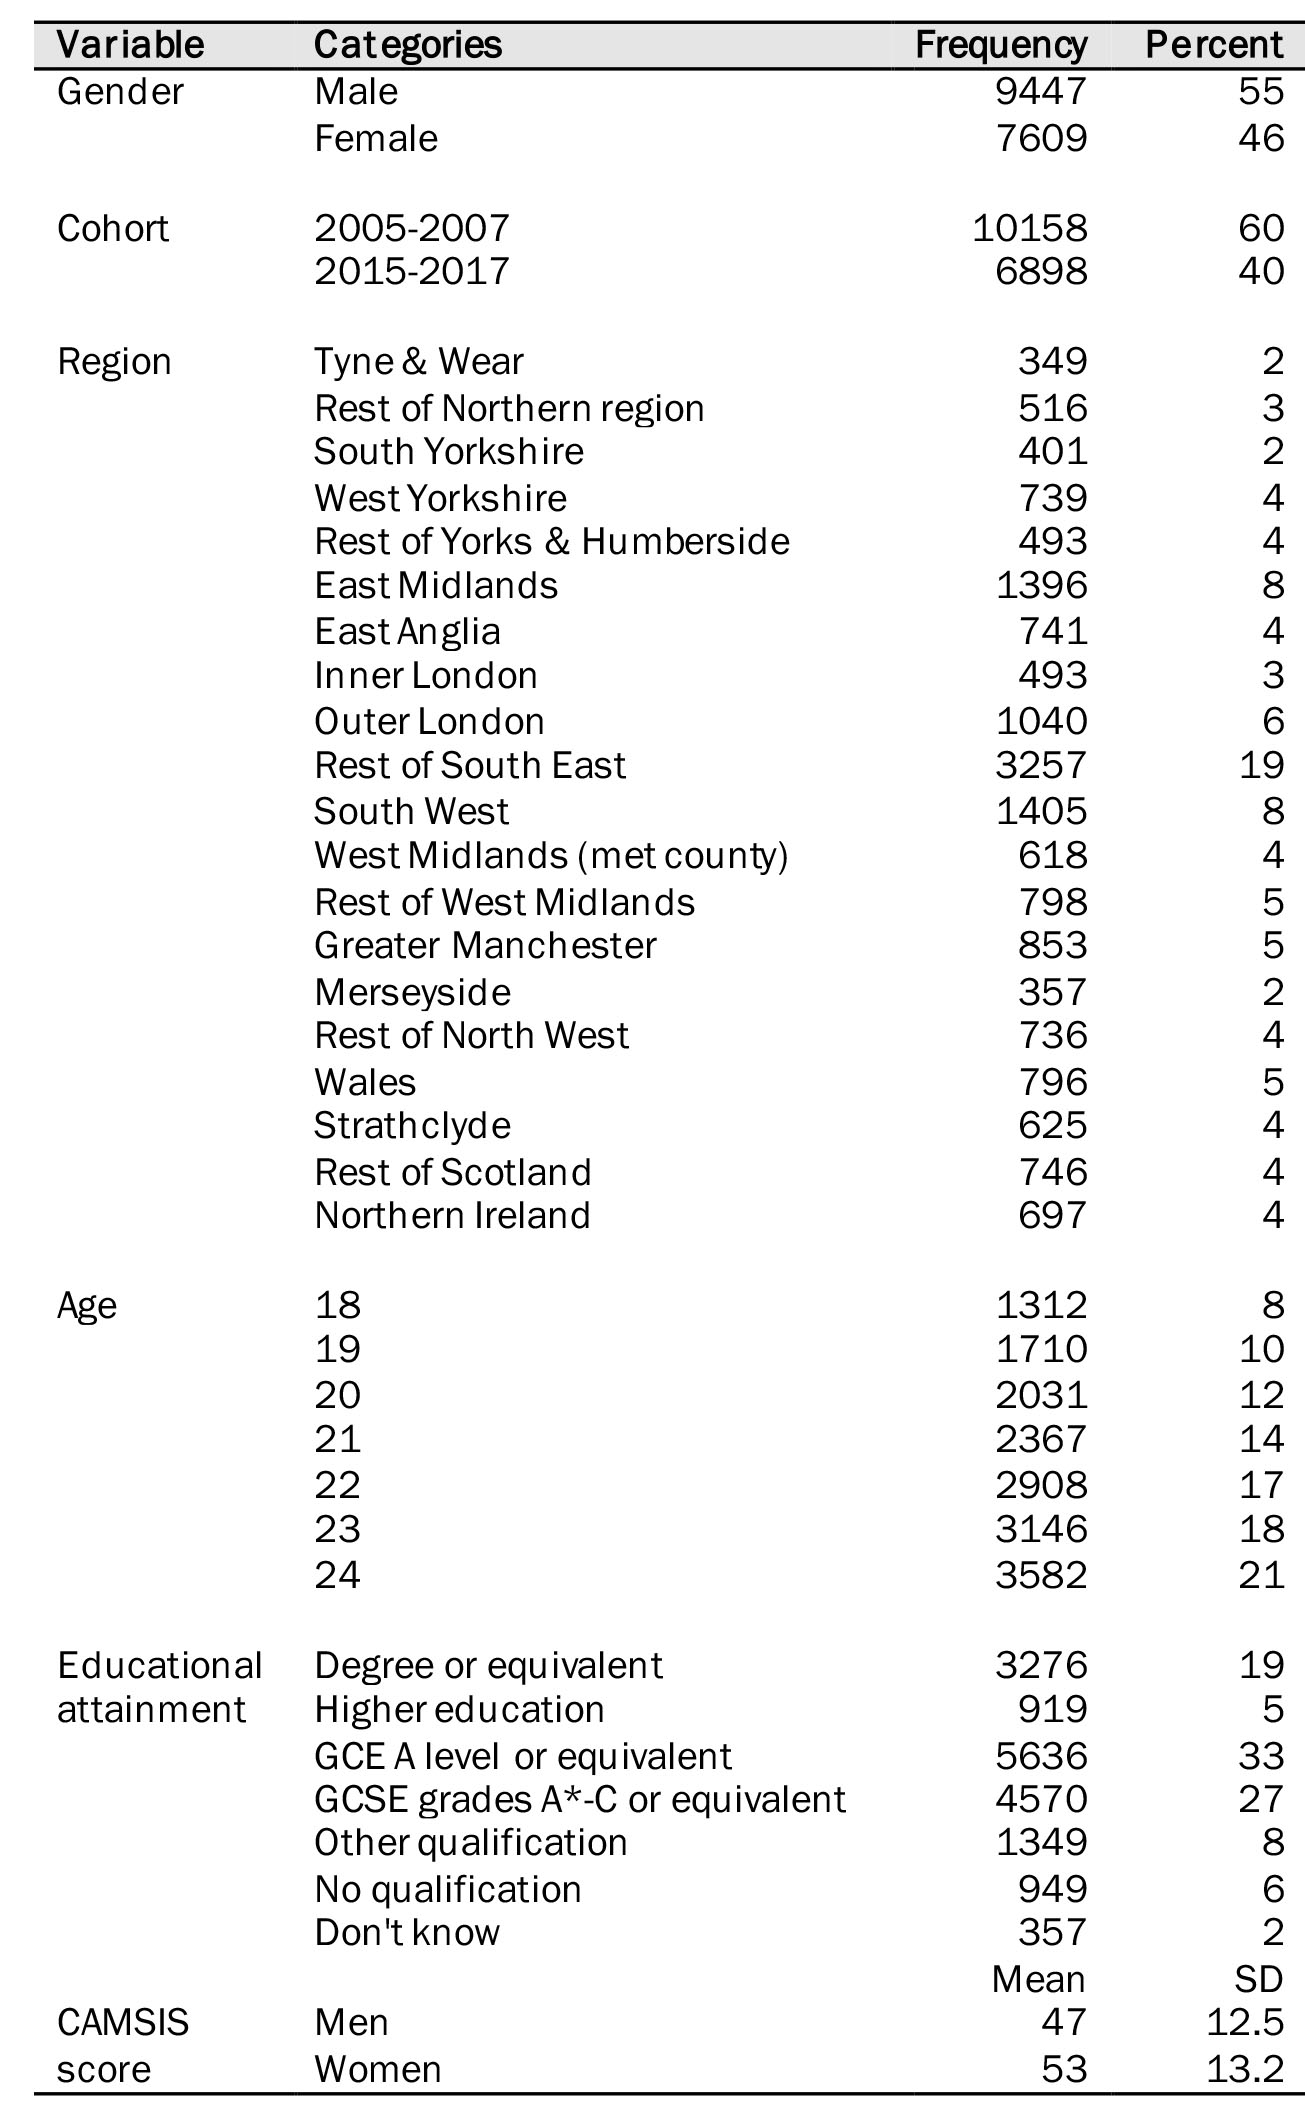
Source: Labour Force Survey, pooled quarterly datasets 05-07, 15-17.
SD – standard deviation.
Results
General trends and regional inequalities
Table 2 describes the mean CAMSIS score of young people by gender comparing the time points 2005-07 with 2015-17. A statistically significant uplift in position is evident, although the magnitude is small for men and particularly women. Table 3 breaks the trend down by region. A statistically significant uplift in position is again evident between many regions for men. The pattern for women in this descriptive table is one of continuity, as the CAMSIS scores are similar across the time points and there are no statistically significant differences within regions. Transferring this to a modelling context, Table 4 provides results from regression models of CAMSIS score for men and women separately, controlling for educational attainment level and age. The models include a variable contrasting the score for youth workers in 2005-2007 with 2015-2017. Here it can be seen that the average score for men was slightly higher for the 2015-2017 period than the 2005-2007 reference category (Coefficient [Coef] 1.1, lower confidence interval [lci] 0.6, upper confidence interval [uci] 1.6). For women the opposite pattern is evident, and there has been a drop in the average occupational position between the time periods (Coef. -1.2, lci. -1.8, uci. -0.7). This results for women contrast with the descriptive tables and indicate that, once differences in education and age have been controlled, the pattern is negative.
Modelling regional change in occupational position
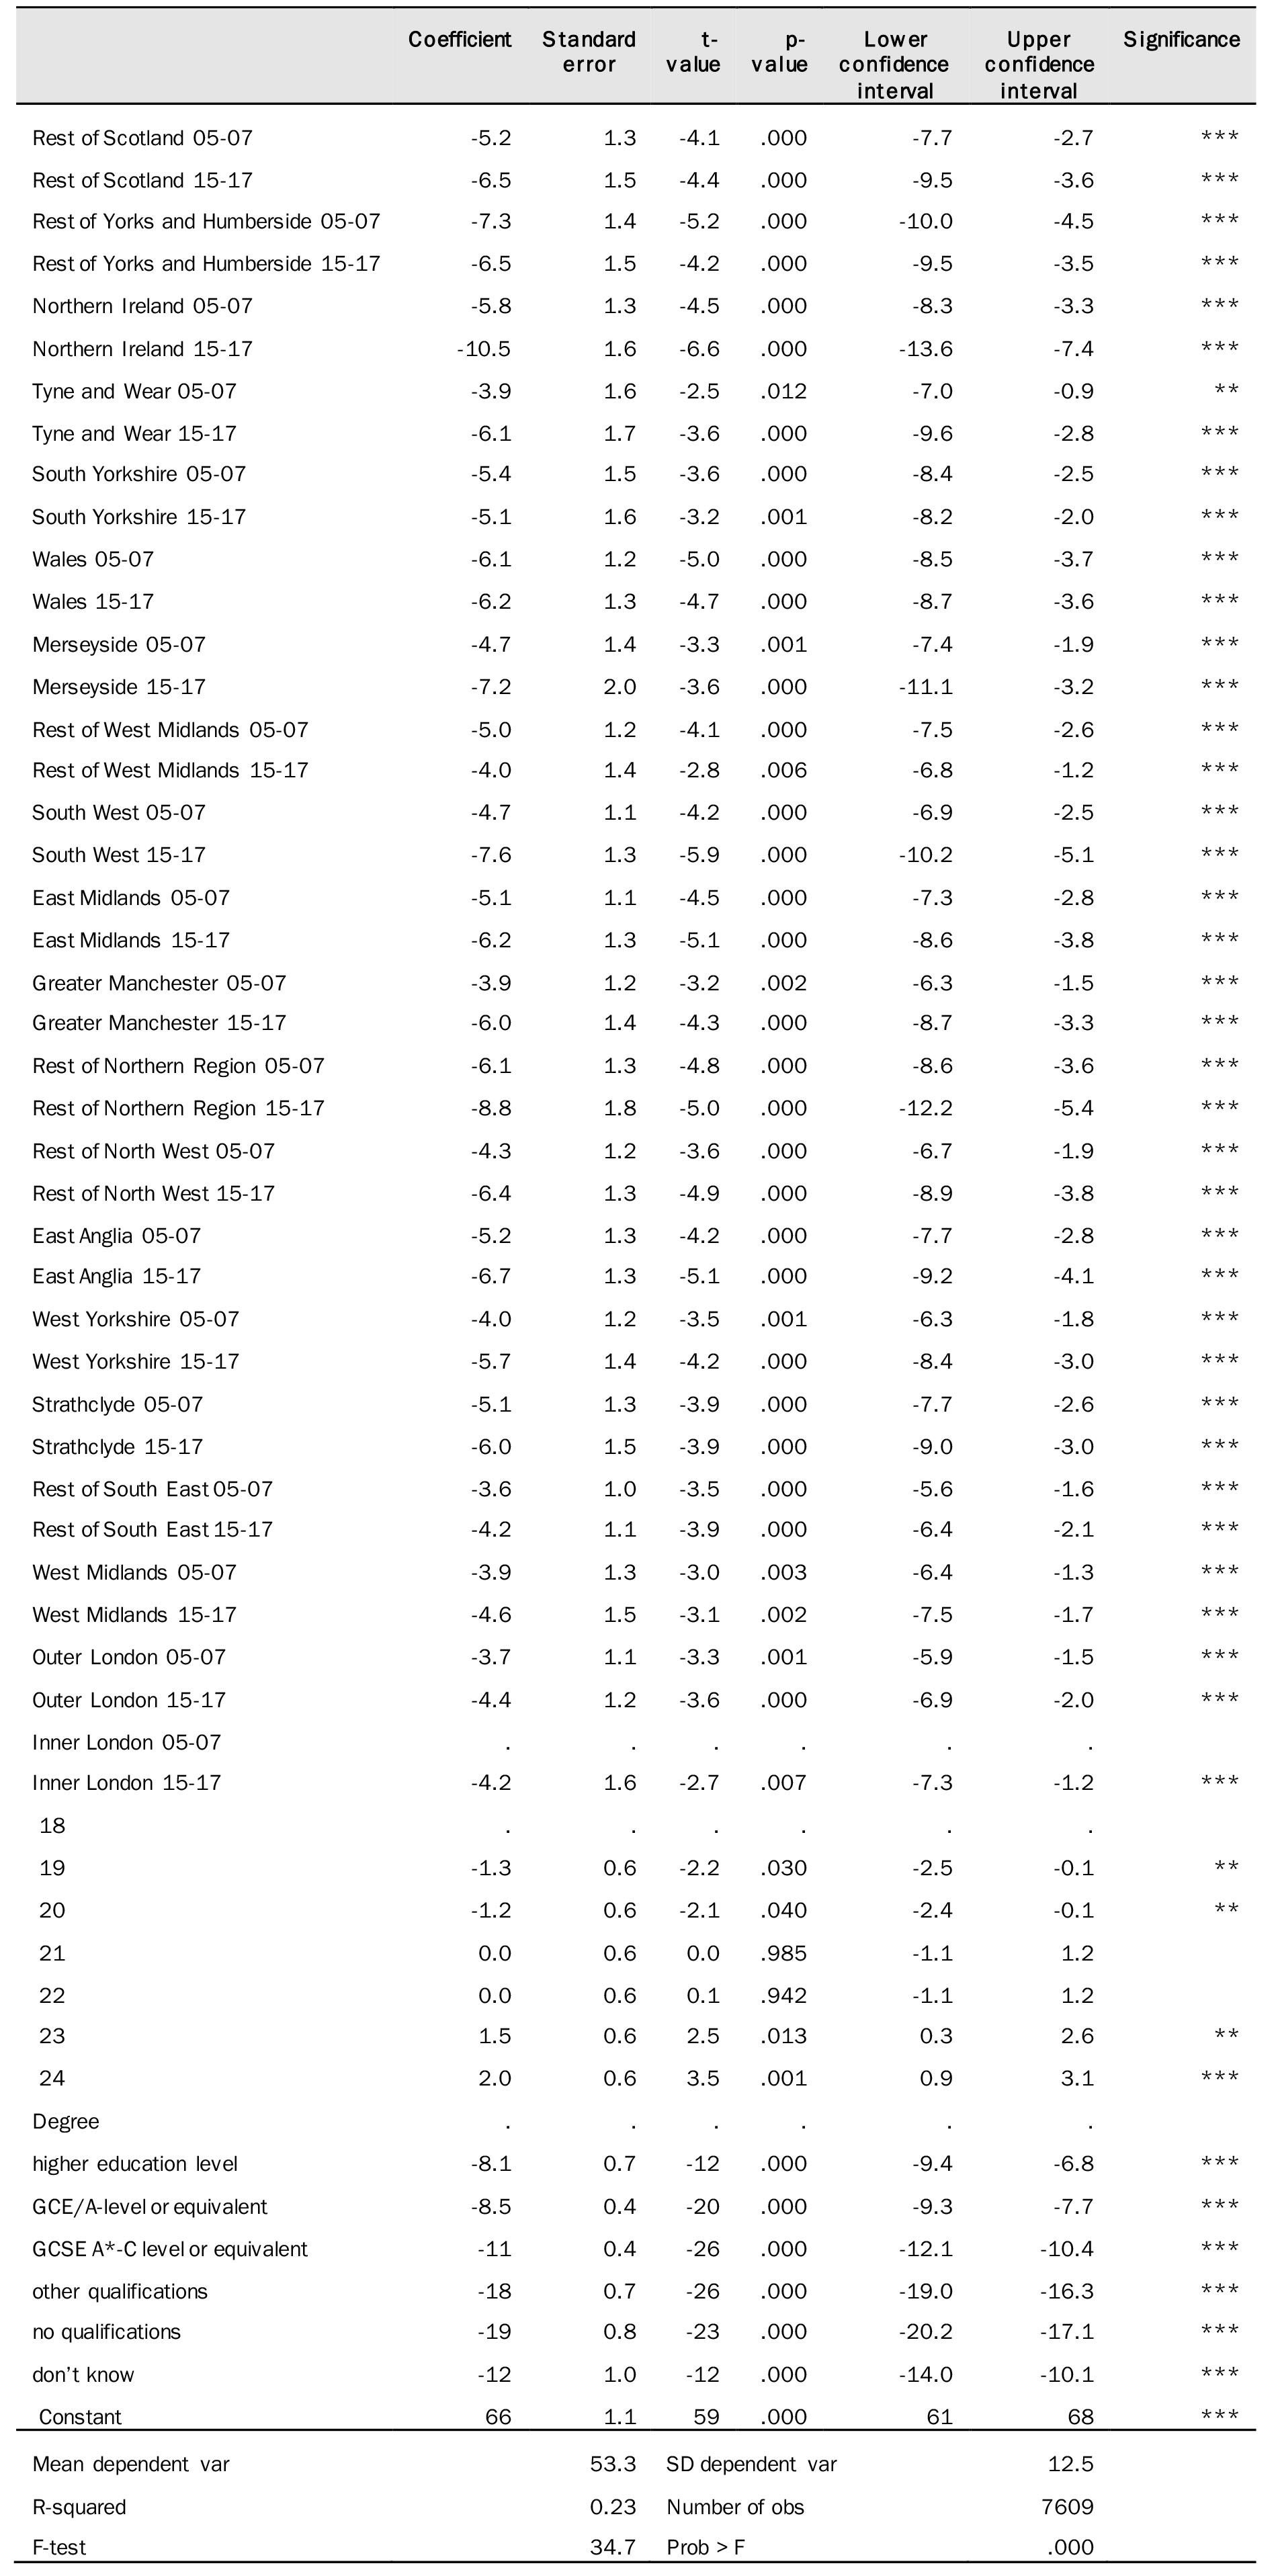
Full models controlling age, education and region interacted with the time points ten years apart, by gender, are provided in Table 5. These models take the most advantaged region, inner-London in the time period 2015-2017, after the Great Recession, as the reference category. All other regions report negative coefficients in comparison, whether before or after the Great Recession, for both men and women. Examining the results for men, a first point to note is that inner-London 2005-2007 scores virtually identically to inner-London ten years later. There has been no drop off in the average occupational position for men in inner-London across the period. A second point is that a number of regions where the contrast with inner-London 2015-2017 was significantly different for the 2005-2007 period are not significantly different for the 2015-2017 period. This is the case for the rest of Yorkshire and Humberside, Tyne and Wear, South Yorkshire, Merseyside, Greater Manchester, East Anglia, West Yorkshire and Strathclyde. This is further evidence that there has been an uplift in average occupational position for men in many regions.
For women, the modelling results contrast with the results in Table 3 and those for men, and suggests a trend of decline in the average occupational position. A first point here is that that inner-London of 2005-2007 scores statistically significantly higher than 2015-17, suggesting that there has been a decline in the average position for women in inner-London.1 The general pattern of decline is re-enforced by the estimates for other regions. Most other regions are non-statistically significantly different from inner-London 2015-17. Several regions score statistically significantly lower than the inner-London reference category, only one of these was a region measured at the 2005-07 time point (the rest of Yorkshire and Humberside). Again, this is evidence that the regions have tended to experience a decline across the period. The position for women in inner-London has dropped so that it is no different from the average position in most regions. While a minority of regions have experienced a drop that maintains them as significantly worse than inner-London, a region which has itself undergone a decline by comparison to 2005-07 (see the margin estimates in Figure 2 for a visualisation of this pattern).
Table 2: Mean CAMSIS score of young workers

Source: Labour Force Survey, pooled quarterly datasets 05-07, 15-17.
*** p<.001, ** p<.01, * p<.05.
n=9447 men n=7609 women.
Note: Mean CAMSIS score of young people aged 18-24 in full-time employment in the UK comparing the three year period prior to the Great Recession of 2008 with the equivalent ten years later (standard deviation), t-tests have been conducted to compare between time points.
Table 3: Mean CAMSIS score of young workers by region
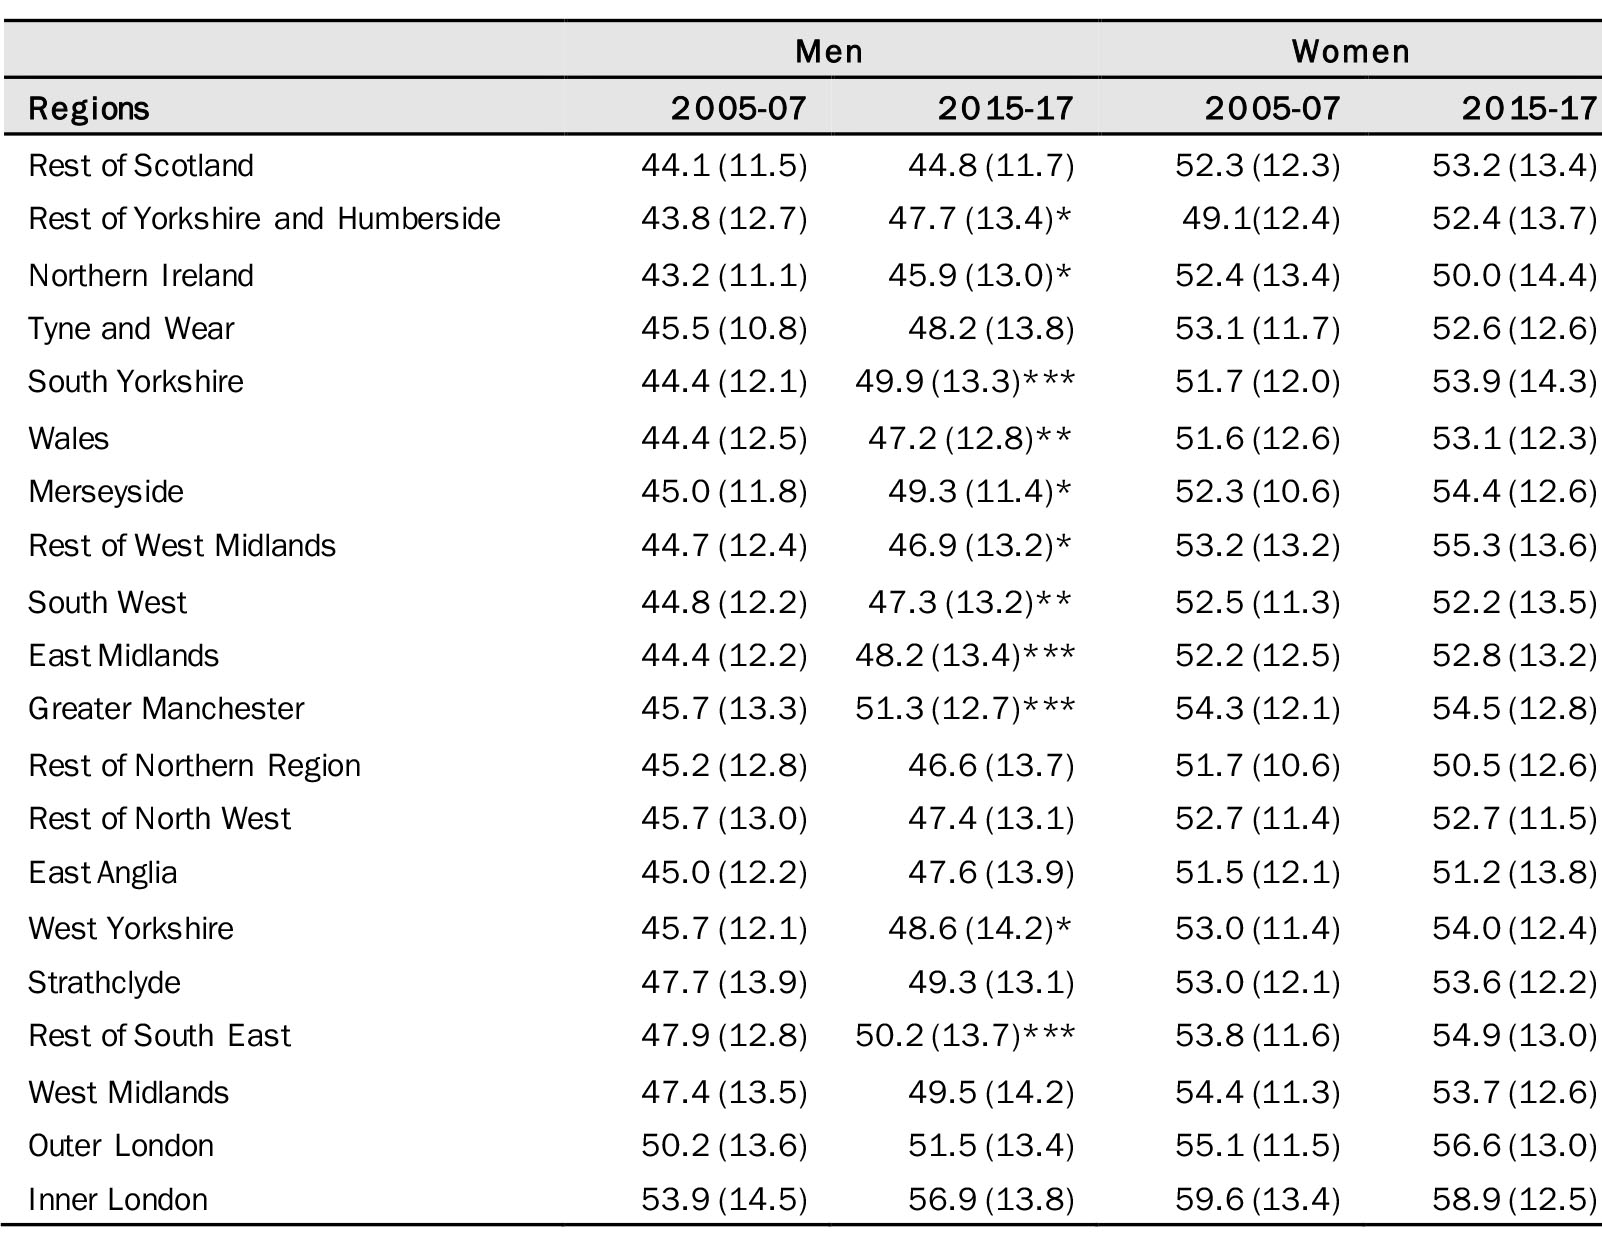
Source: Labour Force Survey, pooled quarterly datasets 05-07, 15-17.
*** p<.001, ** p<.01, * p<.05.
n=9447 men n=7609 women.
Note: Mean CAMSIS score of young people aged 18-24 in full-time employment by region (standard deviation). t-tests have been conducted to compare between time points within regions.
The relatively complex patterns described above are more clearly evident in the graphs of the marginal estimates. Figures 1 and 2 indicate the predicted marginal scores of the CAMSIS occupational position estimated from the models reported in Table 5. For men, the uplift across many regions is evident, indicating an improved average occupational position across the ten-year time period, and a number of regions ‘catch up’ with inner-London. For women, the general trend is a slight decline in average CAMSIS score ten years after the Great Recession, with inner-London 2015-17 dropping back towards the average level.
Overall, the results indicate a restructuring in regional occupational inequality. For men, there has been an uplift in several regions that has moved them closer to inner-London, which had been the highest performing regional economy in terms of the average occupational position of young people. In this respect it seems that inner-London no longer outperforms many of the regions it has in the past. For women the general trend is a drop off in occupational position across the time periods. This has also restructured regional inequality as a substantial drop has occurred for inner-London. Although the trend for women is the obverse of men, the outcome is similar as inner-London no longer appears to outperform many regions.
Table 4: Linear regressions, CAMSIS score of men and women, comparing time periods
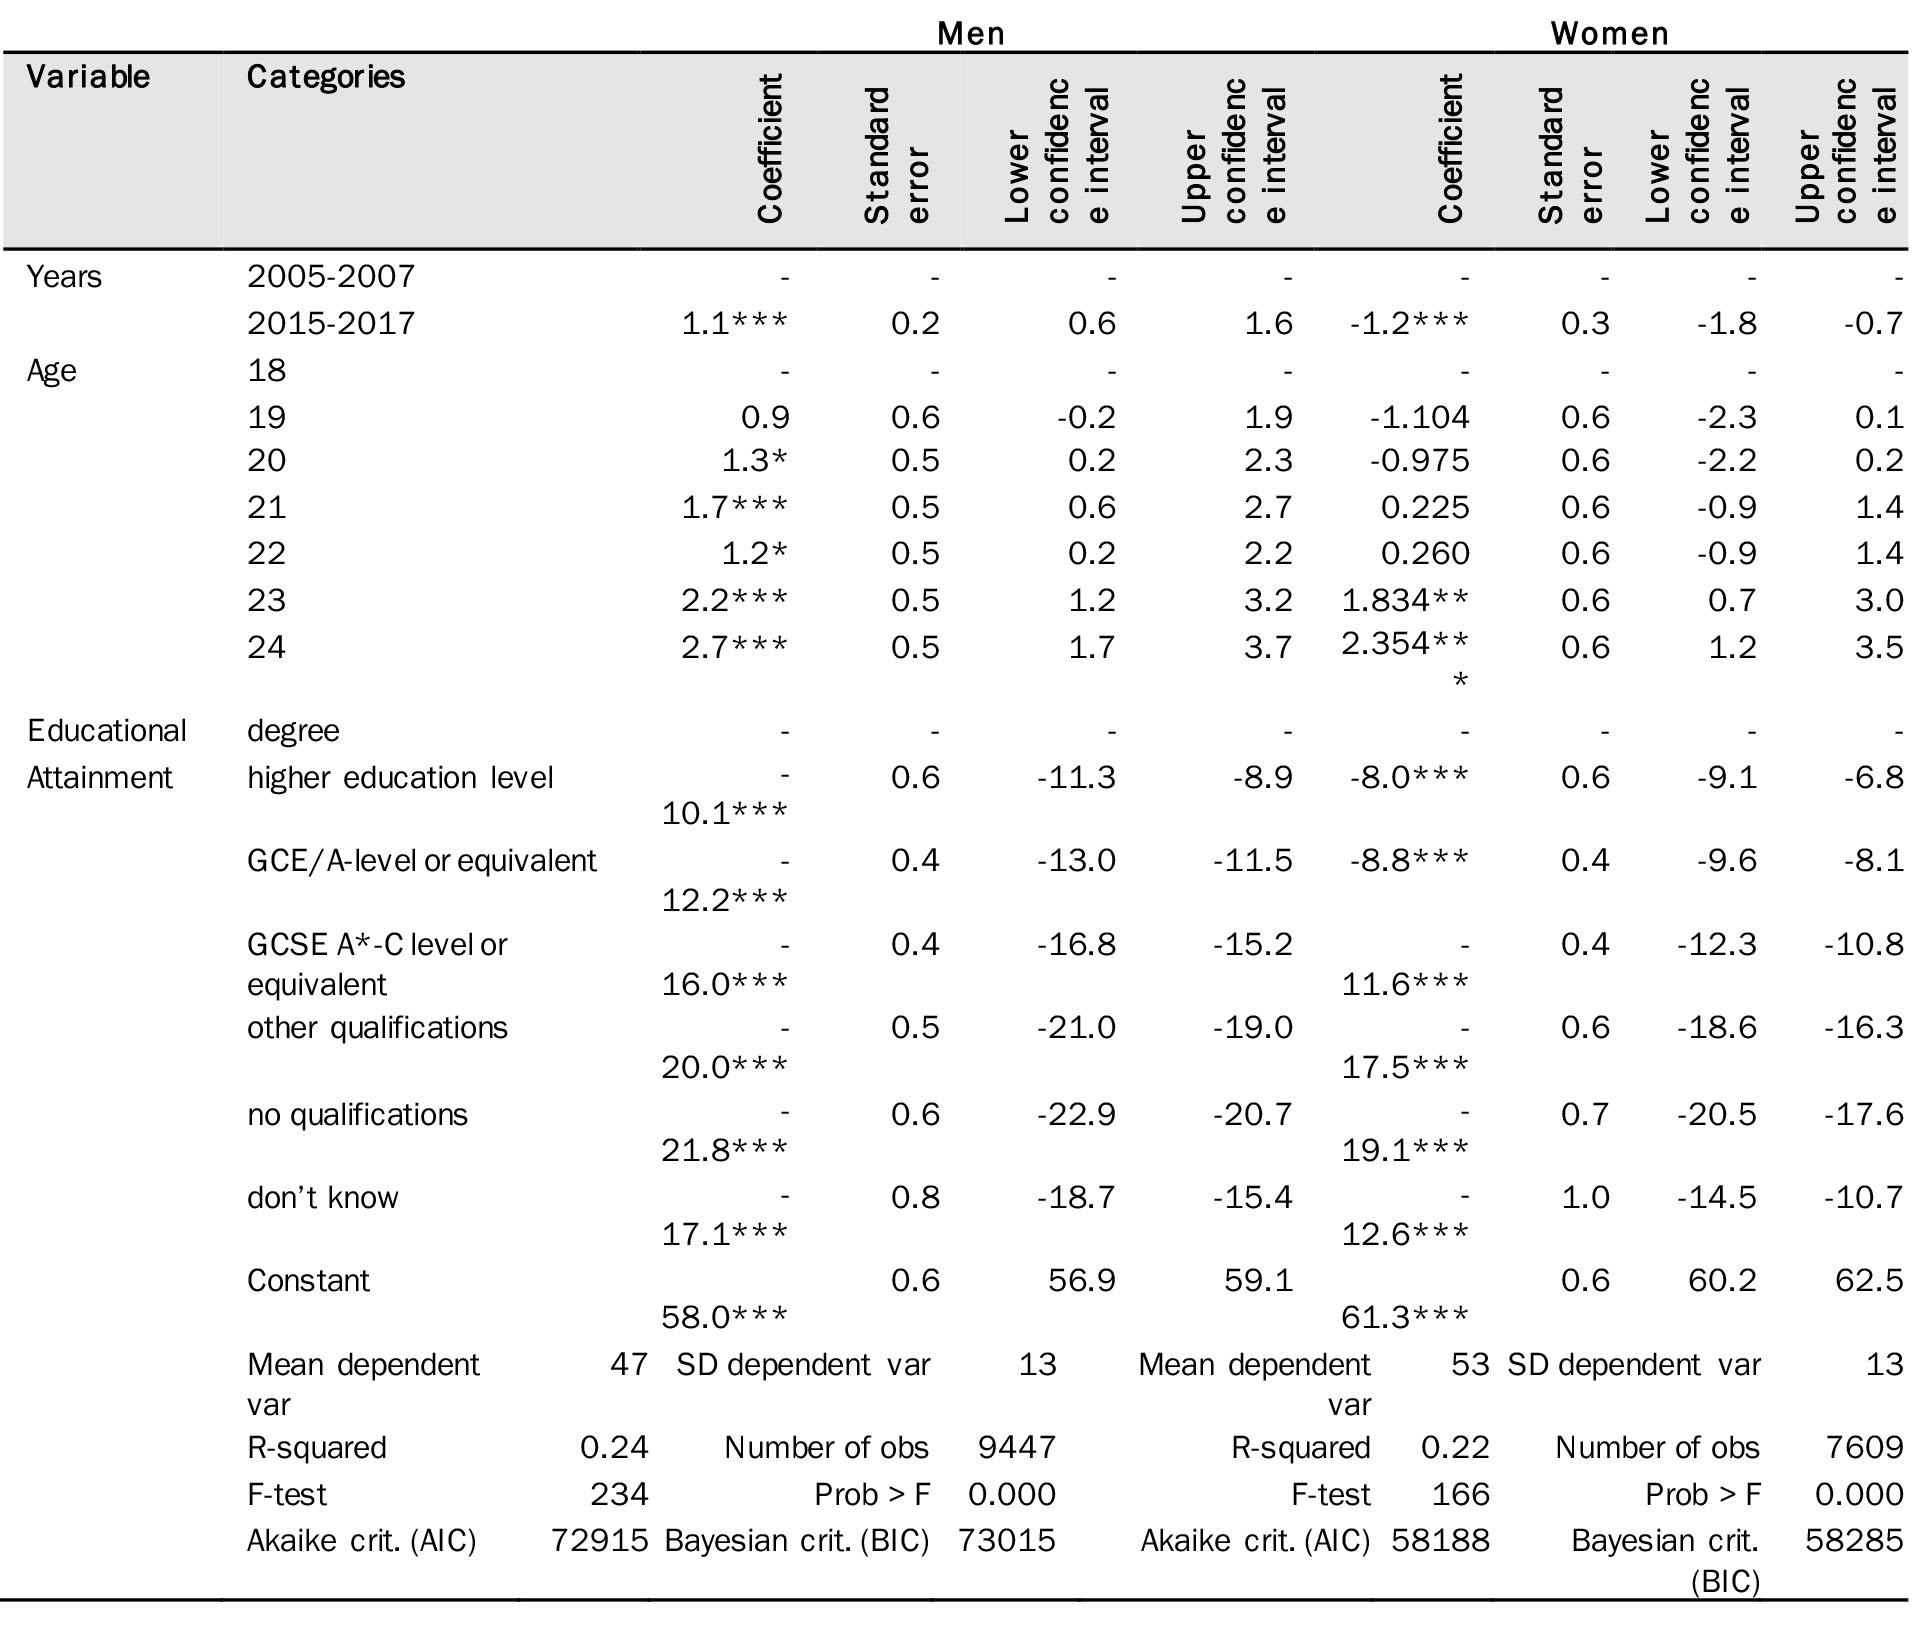
Note: *** p<.001, ** p<.01, * p<.05, Source: Labour Force Survey, pooled quarterly datasets 05-07, 15-17. Linear regressions – CAMSIS score of men and women, the models compare time periods 2005-2007 and 2015-17, controlling for age and educational attainment.
Table 5: Linear regressions, CAMSIS score of men and women by region
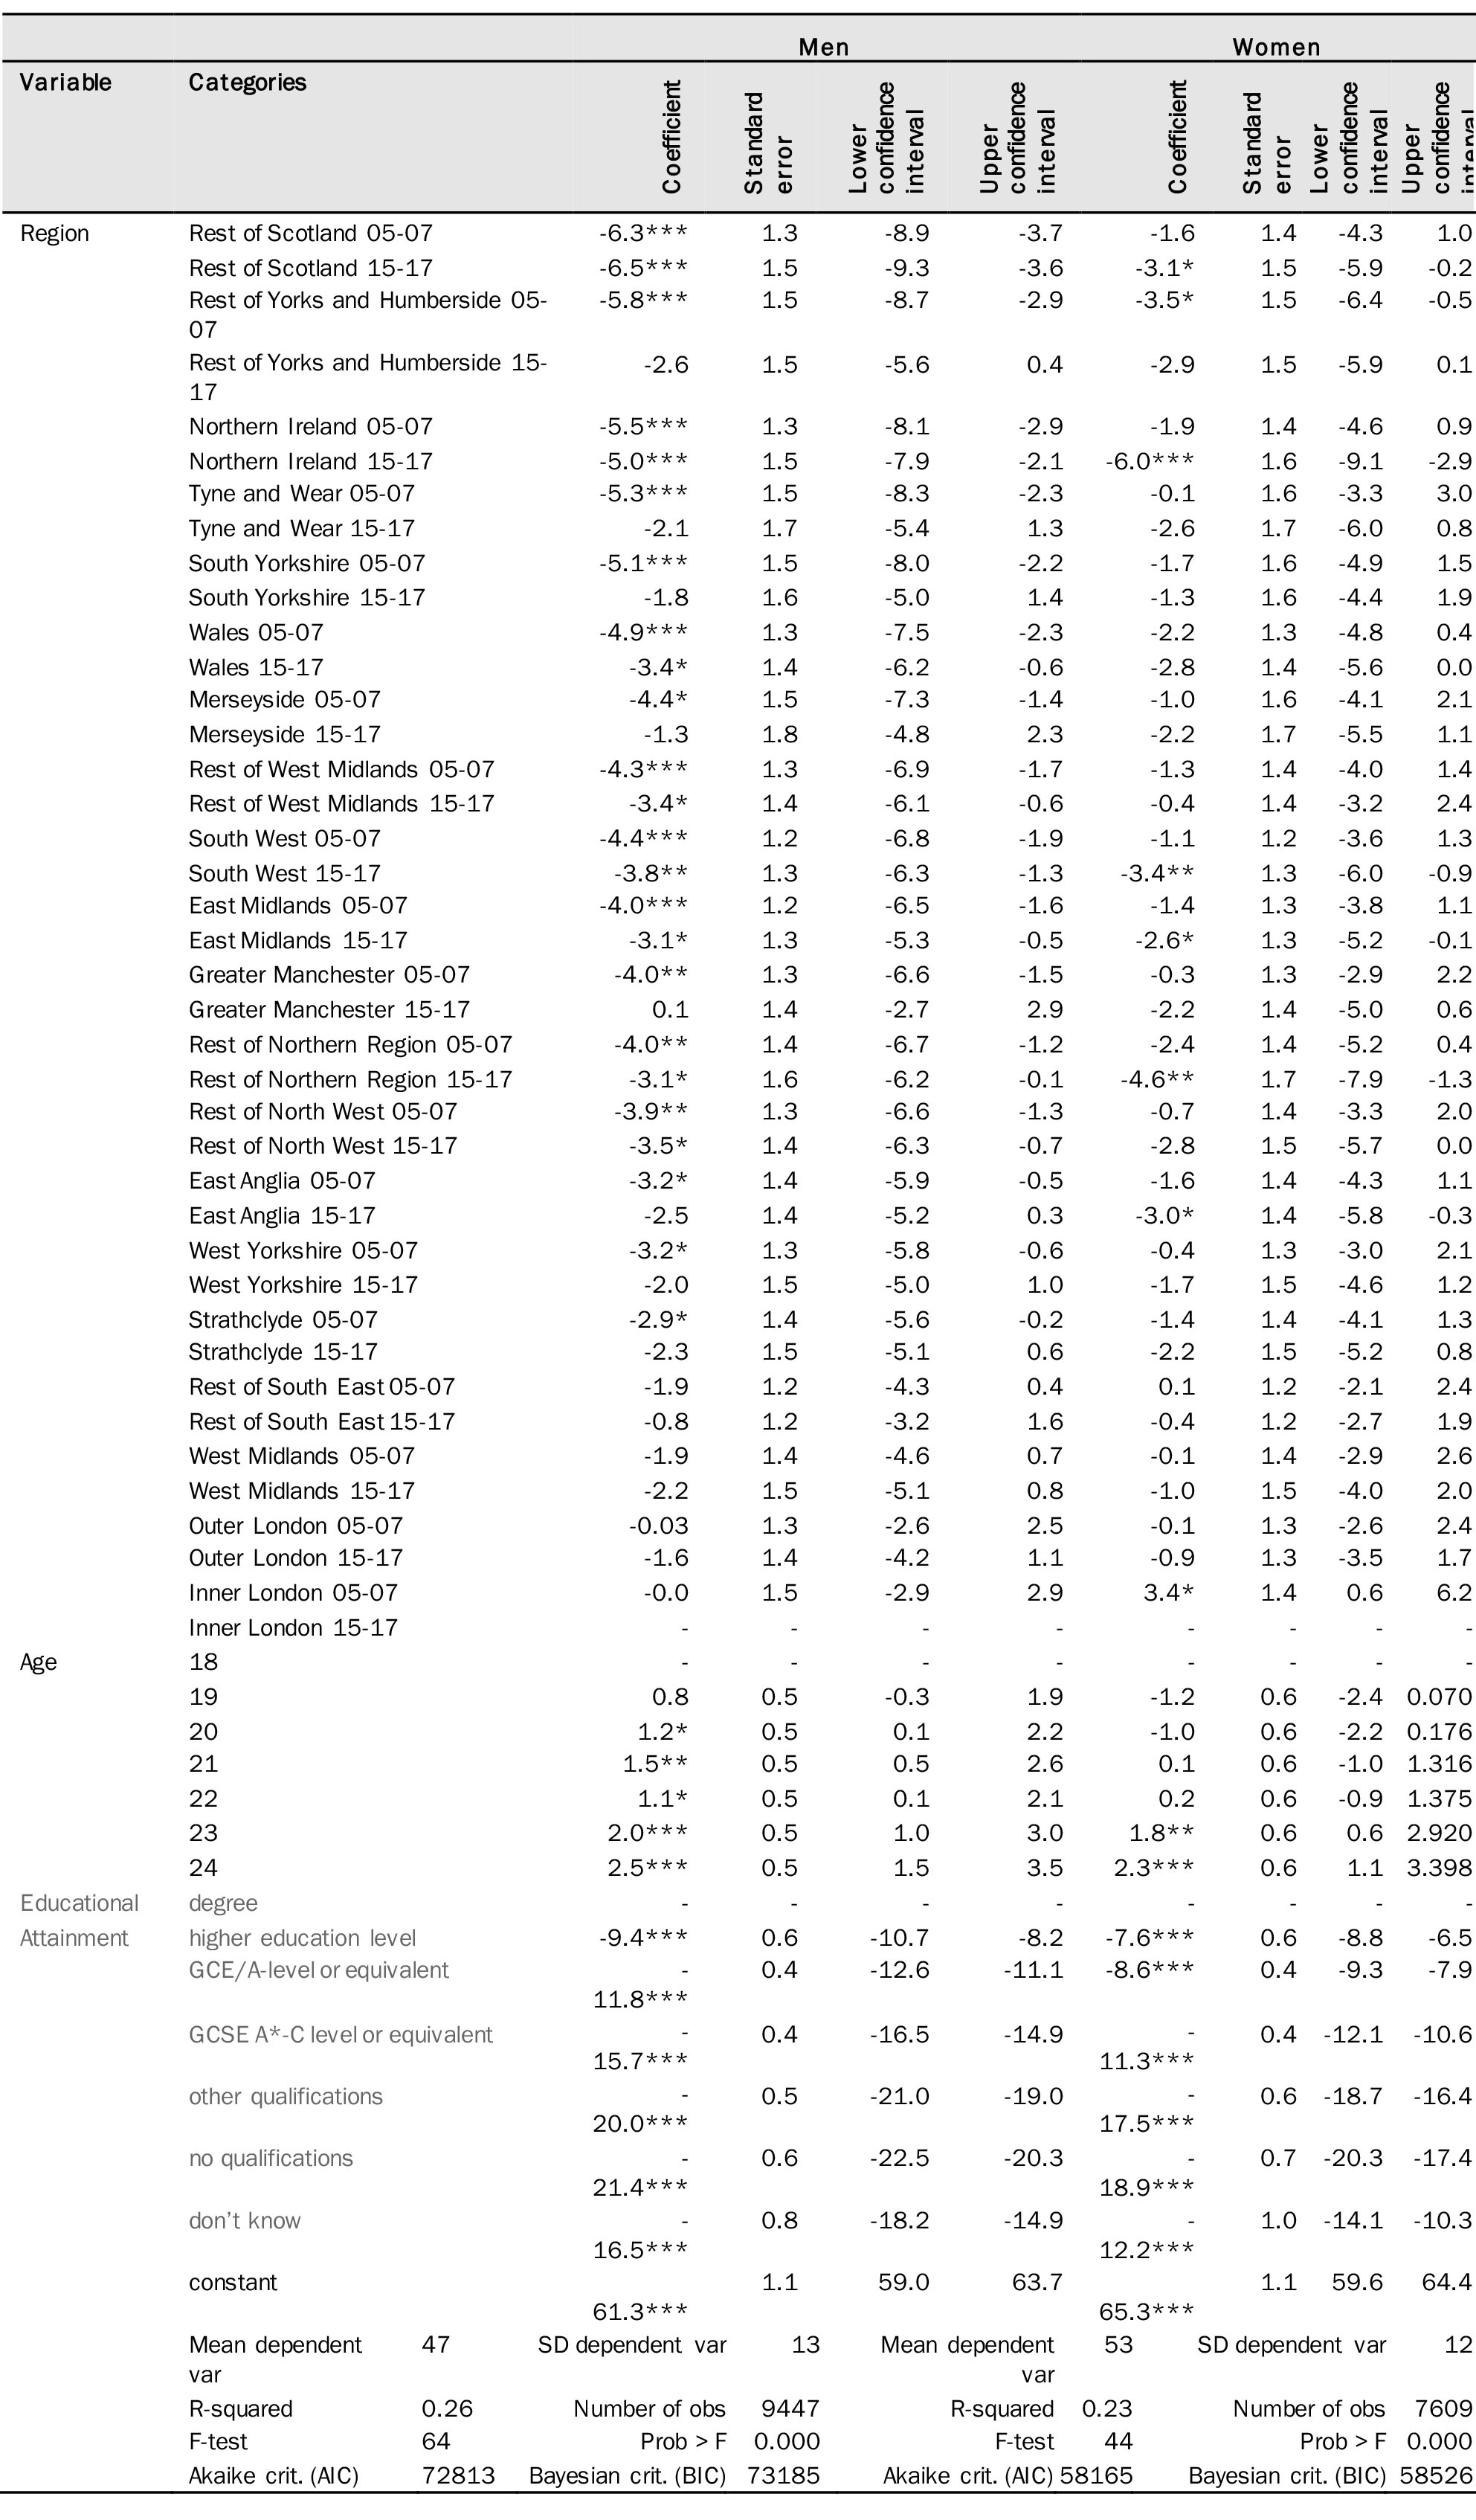
Note: *** p<.001, ** p<.01, * p<.05, Source: Labour Force Survey, pooled quarterly datasets 05-07, 15-17. Linear regressions – CAMSIS score of men and women, the models compare time periods 2005-2007 and 2015-17 by region, controlling for age and educational attainment.
Figure 1: Marginal estimates of CAMSIS for men by region

Figure 2: Marginal estimates of CAMSIS for women by region

The continued hollowing out of the youth job market
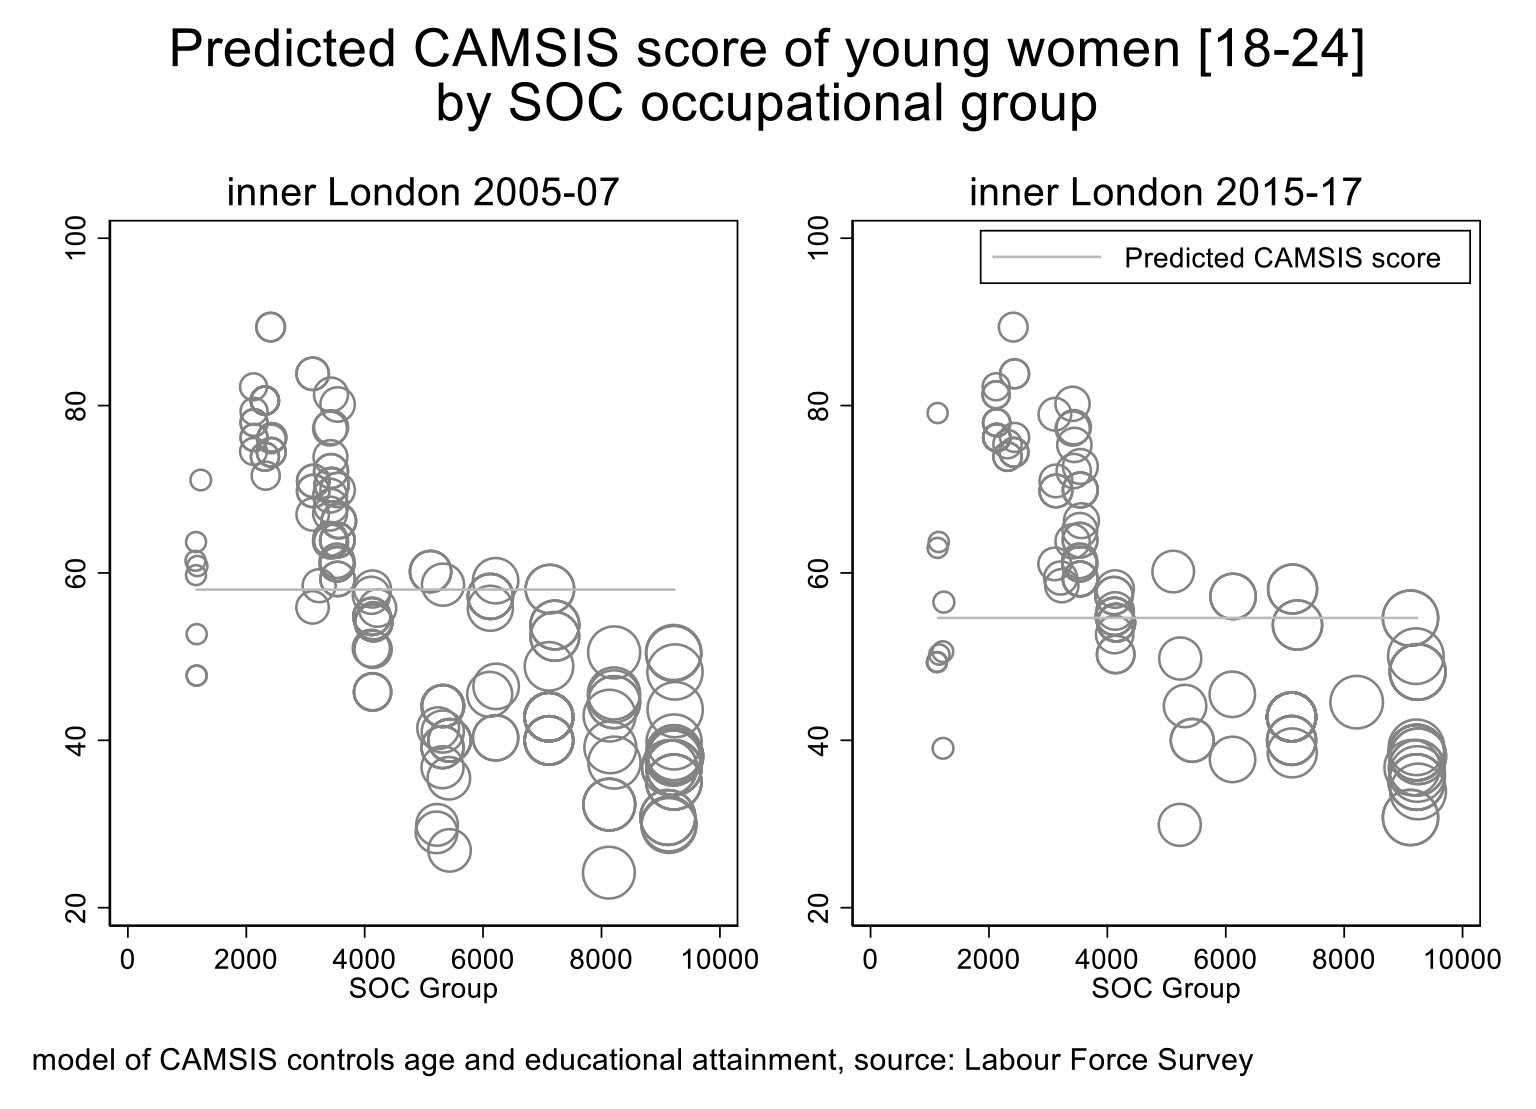
This section looks in more detail at selected regional labour markets. Figure 4 visualises the occupations undertaken by men in Manchester between the time periods under analysis. Figure 5 depicts inner-London, Figure 6 depicts women in Northern Ireland. Figure 7 Women in inner-London. These regions are highlighted because they report either the greatest levels of change or the most stable continuity across the period. Occupations are included in the figures using four-digit standard occupational groups (SOC). An occupation will only appear in a figure if there are young people employed within it, within the region. The graph weights each occupation by the numbers employed in that occupation. Larger bubbles represent occupations employing more young people. The CAMSIS score of occupations is included on the graph y-axis. The predicted CAMSIS score is the estimate from the marginal model for that region, controlling for age and educational attainment.
For men in Greater Manchester, Figure 4, the estimated average occupational position increases more than five points between the periods. This uplift, however, reflects the disproportionate disappearance of youth workers from lower status jobs. This elimination from occupations is evident by simply comparing between the time periods, where the density of the bubbles is far higher in the 2005-2007 period. Figure 5 depicts inner-London, the average occupational position of men has been maintained between the periods, but again, the numbers of young people employed, and the diversity of occupations has declined substantially. Figures 6 and 7 visualise the equivalent pattern for women in Northern Ireland and inner-London. In both regions the average occupational position has lowered, driven by a disproportionate loss of more advantaged occupations. Yet again, the visualisations reveal this in a lower density of the bubbles between periods, representing the thinning out of occupations employing young people. Overall there has been a continuation of the decline of the youth labour market and this has driven the regional and temporal trends highlighted in detail above.
Figure 3: Temporal comparison of the youth labour market of Greater Manchester, men

Figure 4: Temporal comparison of the youth labour market of inner London, men

Figure 5: Temporal comparison of the youth labour market of Northern Ireland, women
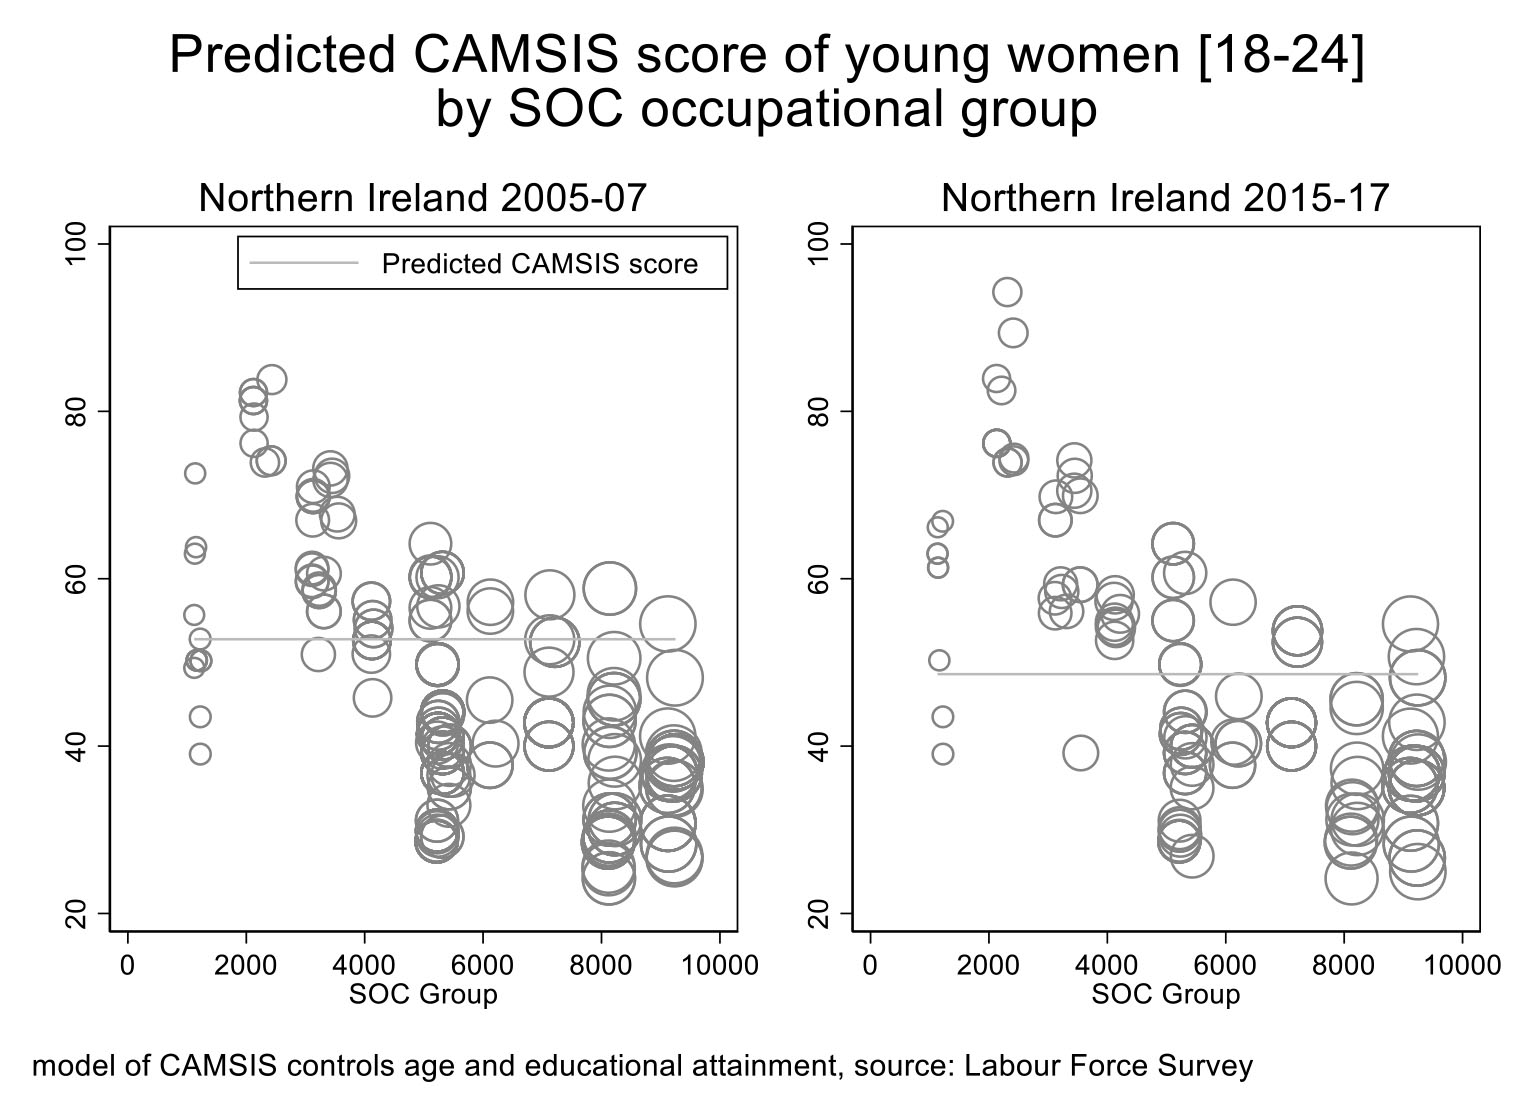
Figure 6: Temporal comparison of the youth labour market of inner London, women
Discussion
The extent of the restructuring of the youth labour market that appears to have occurred following Great Recession of 2008 is striking. It seems that there is now greater regional equality – although this has been driven by negative trends of job losses, and lowering of the average position of women. A second aspect of this is that London may no longer be driving occupational advantage as it was in the past. A major feature of this is that there has been a collapse in numbers of young people in work in all parts of the UK. The analysis points to a national trend in this regard, irrespective of regional context. The extent and nature of this collapse is further accentuated by the thinning out at all levels of occupations. Although the labour market has disproportionately shed lower status jobs for men, for women it has disproportionately lost higher status jobs. Roberts (2009) argued there is both a lack of jobs and ‘good’ jobs for young people to do. This fits with the trends reported above. Our analysis clearly illustrates that, for young people not in education – the opportunities offered in youth labour markets around the UK are fewer in comparison to pre-recession. In effect, this further reduces young people’s agency in the job market as there may simply be a lack of available jobs for them to do.
Polarisation has been given as an explanation for the collapse in jobs (Goos and Manning, 2003). This posits that demand for ‘middling’ jobs is falling due to increased computational technologies (Autor, Levy and Murnane, 2003) – this may have impacted youth labour markets through ‘knock-on’ effects. The evidence shows young people were squeezed out of the types of occupation in which that would have previously employed them (Oritz and Cummins, 2012). In turn, this is likely a factor that drives young people to engage with alternatives such as apprenticeships, further and higher education. Hoskins et al. (2018) find most young people are now delaying transitions into the labour market and opting for higher educational qualifications – with the specific aspiration to improve job prospects. An additional concern here is the extent that the youth unemployment problem has been ‘disguised’ through the process of ‘warehousing’ in education (Roberts and Parsell, 1992; MacDonald, 2011). This is not to say that youth labour markets are entirely negative for young people that enter work quickly as many enjoy earning and view this is as part of their transition to adulthood (Hoskins et al., 2018: 76). However, in comparing pre-and-post recessional labour markets, the results suggests the youth labour market now offers far less opportunity than before – especially for those with lesser or no qualifications. As MacDowell comments, “young people without skills, education and often jobs, but not without determination and ambition, are the ones who will bear the main brunt of the uncertainty” (MacDowell, 2012: 587).
The results presented offer a clear challenge to supply-sided approaches of conceptualising unemployment that focus on individual ‘employability’. The attempt to ‘activate’ young people to enter work is a limited solution when substantial numbers of jobs have become inaccessible (Crisp and Powell, 2017: 1790). The supply-side orthodoxy and its emphasis on up-skilling young people through increased ‘employability’ needs further reflection. As relative job opportunities decrease in youth labour markets, there is greater need to reflect on how to stimulate demand (Bell and Blanchflower 2011) or at least start convincing policy makers that “youth unemployment must be understood not only in the context of individual characteristics, but also local labour market demand” (Crisp and Powell, 2017: 1800).
Conclusion
Sociology has built evidence that occupation is the most powerful general indicator of life chances, social and material reward and status, available (Connelly et al, 2016a). Sociological analysis of the youth labour market has focussed on its long-run loss of jobs (e.g. MacDonald et al., 2005; Crisp and Powell, 2017) and the growth of ‘precarity’ (e.g. Standing, 2011; Antonucci, 2018). Far less attention has been paid to the parallel issue of occupational position and whether there have been measurable shifts in the relative advantage of youth work. The research presented above is a step towards filling this substantial gap in the international literature.
The decade since the great recession has seen changes in patterns of regional inequality in the youth labour market, for men and women in the UK. For young men, there has been a disproportionate loss of less advantaged occupations raising the average occupational position in a number of regions. For women, the opposite trend has occurred; there has been a disproportionate loss of more advantaged occupations, leading to a general drop in the average advantage level. This has led to a shift in levels of interregional inequality in the occupational position of men, because the average trend did not play out in inner-London, leading other regions to ‘catch up’. For women, the loss of more advantaged jobs seems to have been exacerbated in inner-London, leading it to drop back towards the average level. This has reduced interregional inequality, but only as a result of the arguably negative structural adjustments highlighted (i.e. the continued hollowing out of the youth labour market).
This analysis has limitations. The attrition rate of the Labour Force Survey Dataset has risen in the interim between 2005-07 and 2015-17. A disproportionate loss of cases by variables of interest would lead to bias. Although we have used appropriate weights (developed in tandem with UK CENSUS data) to check for reliability (see Tables 6 and 7). More broadly, there is an additional concern that youth labour markets have firmly moved towards temporary, low-skilled and low-waged positions (MacDonald et al., 2001, 2005) – and these are now fundamentally the only choice that many young people have left in the UK. The analysis does not look into the composition of labour market positions e.g. the extent they are secure or insecure. Future research in this area could examine in detail the types of occupation that have been lost to young people and changes in conditions for those remaining. The argument is made above that ‘place’ is important in transitions to work, reflecting the need for a local labour market to provide opportunity and important regional trends are highlighted. The regional measure used is still a basic operationalisation, highlighting broad aggregate trends. More granular analyses of youth labour markets could be undertaken in future.
Table 6: Linear regression, CAMSIS score of men, weighted using individual level person weights
Note: *** p<0.01, ** p<0.05, * p<0.1 Source: Labour Force Survey, pooled quarterly datasets 05-07, 15-17, CAMSIS score of men, applying LFS individual level person weights, controlling region, age and educational attainment
Table 7: Linear regression, CAMSIS score of women, weighted using individual level person weights
Note: *** p<0.01, ** p<0.05, * p<0.1 Source: Labour Force Survey, pooled quarterly datasets 05-07, 15-17, CAMSIS score of women, applying LFS individual level person weights, controlling region, age and educational attainment
1 For comparison, the models provided in Appendix 1 take inner-London in the time period 2005-2007 as the reference category. This provides additional support to the argument, made in the main text, that there has been an uplift in position for men in many regions, but a drop off for women (Table 5, Figures 1 and 2). The comparison for women is particularly stark. All regions are negative and significant in comparison to inner-London 2005-2007. Only six regions are significantly lower than inner-London taken at 2015-2017. A substantial shift, indicating the relative decline of inner-London noted in the main text.
Dr Adam Formby, York St John University, Lord Mayor’s Walk, York YO31 7EX. Email: a.formby@yorksj.ac.uk
Antonucci, L. (2018) Not all experiences of precarious work lead to precarity: the case study of young people at university and their welfare mixes. Journal of Youth Studies, 21, 7, 888-904. CrossRef link
Autor, D. Levy, F. and Murnane. R, J. (2003) The skill content of recent technological change: An empirical exploration. The Quarterly Journal of Economics, 118, 4, 1279–1333. CrossRef link
Bell, D., N. F. and Blanchflower, D. G. (2011). Young people and the Great Recession. Oxford Review of Economic Policy, 27, 241–267. CrossRef link
Blau, F., Brummund, P. and Liu, A.-H. (2013) Trends in occupational segregation by gender 1970–2009: Adjusting for the impact of changes in the occupational coding system. Demography, 50, 2, 471–492. CrossRef link
Bynner, J. and Parsons, S. (2002) Social exclusion and the transition from school to work: The case of young people not in education, employment, or training (NEET). Journal of Vocational Behavior, 60, 2, 289–309. CrossRef link
Coles, B. (1995) Youth and Social Policy, Youth Citizenship and Young Careers. London: University College London Press.
Connelly, R., Gayle, V. and Lambert, P. S. (2016a) A Review of occupation-based social classifications for social survey research. Methodological Innovations, 9, 1-14. CrossRef link
Connelly, R., Gayle, V. and Lambert, P.S. (2016b) Statistical modelling of key variables in social survey data analysis. Methodological Innovations, 9, 1-17. CrossRef link
Crisp, R. and Powell, R. (2017) Young People and UK Labour Market Policy: A Critique of ‘employability’ as a tool for understanding Youth Unemployment. Urban Studies, 54, 8, 1784-1807. CrossRef link
Croll, P. (2009) Educational participation post-16: A longitudinal analysis of intentions and outcomes. British Journal of Educational Studies, 57, 4, 400–416. CrossRef link
Crowley, L. and Cominetti. N. (2014) The Geography of Youth Unemployment: A Route Map for Change. Lancaster: The Work Foundation.
Duranton, G. and Monastiriotis, V. (2002) Mind the gaps: the evolution of regional earnings inequalities in the UK, 1982–1997. Journal of Regional Science, 42, 2, 219-256. CrossRef link
Elias, P., McKnight, A. and Kinshott, G. (1999) Redefining skill: Revision of the Standard Occupational Classification (SOC2000) (Skills Task Force Research Paper 19). Nottingham: England: DfEE Publications.
Foley, N. (2020) Youth Unemployment Statistics. London: House of Commons Library.
Formby, A. (2014) Graduates and their engagement of Jobcentre Plus services in difficult times: A mixed methods study, PhD thesis. York: University of York.
Formby, A. (2017) ‘Got a degree…all of a sudden I’m in a Jobcentre’: The Role of ‘Stigma’ in ‘Precarious’ Graduate Transitions. Poverty and Social Justice, 25, 3, 249-262. CrossRef link
Furlong, A. and Cartmel, F. (2007) Young People and Social Change. Milton Keynes: Open University Press.
Gregg, P. and Gardiner, L. (2015) A Steady Job? The UK’s record on labour market security and stability since the millennium. London: Resolution Foundation.
Goos, M. and Manning, A. (2003) Lousy and lovely jobs: the rising polarisation of work in Britain. Oxford review of economic policy, 7, 49-62.
Hardgrove, A., McDowell, L. and Rootham, E. (2015) Precarious lives, precarious labour: Family support and young men’s transitions to work in the UK. Journal of Youth Studies, 18, 8, 1057–76. CrossRef link
Hills, J., Cunliffe, J., Obolenskaya, P. and Karagiannaki, E. (2015) Falling Behind, Getting Ahead: The Changing Structure of Inequality in the UK, 2007-2013. Social Policy in a Cold Climate Research Report No. 5. London: Centre for Analysis of Social Exclusion, LSE.
Hillage, I. (2018) Young people still struggle to thrive in today’s labour market. Institute for Employment Studies.
Hoskins, B., Leonard, P. and Wilde, R, J. (2018) Negotiating uncertain economic times: Youth employment strategies in England. British Educational Research Journal, 44, 1, 61-79. CrossRef link
Junankar, P.N. (2015) The Impact of the Global Financial Crisis on Youth Unemployment. The Economic and Labour Relations Review, 26, 2, 191-217. CrossRef link
Lambert, P.S. (2012) CAMSIS for Britain, SOC2010 01/02/15. Electronic file, version 1.0, date of release: 8 September 2012.
Lee, N., Sissons, P. and Jones, K. (2013) Wage inequality and employment polarisation in British cities. London: Work Foundation.
MacDonald, R., Mason, P., Shildrick, T., Wesbter, C., Johnston, L. and Ridley, L. (2001) Snakes and Ladders: In Defence of Studies of Youth Transition. Sociological Research On-line, 5, 4. CrossRef link
MacDonald, R. and Marsh, J. (2005) Disconnected Youth? Growing up in Britain’s Poor Neighbourhoods. Basingstoke: Palgrave. CrossRef link
MacDonald, R. (2011) Youth Transitions, Unemployment and Underemployment: Plus ça change, plus c’est la même chose? Journal of Sociology, 47, 4, 427-444. CrossRef link
MacDonald, R. and Giazitzoglu, A. (2019) Youth, enterprise and precarity: or what is, and what is wrong with, the ‘gig economy’? Journal of Sociology, 55, 4, 724-740. CrossRef link
MacDowell, L. (2012) Post-Crisis, Post-Ford and Post-Gender? Youth Identities in an Era of Austerity. Journal of Youth Studies, 15, 5, 573-590. CrossRef link
McQuaid, R. and Lindsay. C. (2005) The Concept of Employability. Urban Studies, 42, 3, 197–219. CrossRef link
Office for National Statistics (2011) Labour Market Statistics, November 2011. London: Office for National Statistics.
Office for National Statistics, Northern Ireland Statistics and Research Agency (2019) Quarterly Labour Force Survey, July – September, 2019. [data collection]. UK Data Service. SN: 8588.
Ortiz, I. and Cummins, M. (2012) When the Global Crisis and Youth Bulge Collide: Double the Jobs Trouble for Youth, SSRN. Available at SSRN. CrossRef link
Papoutsaki, D., Byford, M., Wilson, T. and Newton, B. (2019) Young People’s Future Health Inquiry. Brighton: Institute for Employment Studies.
Pemberton, S., Fahmy, E., Sutton, E. and Bell, K. (2016) Navigating the stigmatised identities of poverty in austere times: Resisting and responding to narratives of personal failure. Critical Social Policy, 36, 1, 21–37. CrossRef link
Prandy, K. and Jones, F.L. (2001) An international comparative analysis of marriage patterns and social stratification. International Journal of Sociology and Social Policy, 21, 4/5/6, 165–183. CrossRef link
Prandy, K. and Lambert, P. (2003) Marriage, social distance and the social space: An alternative derivation and validation of the Cambridge scale, Sociology, 37, 3. 397–411. CrossRef link
Ralston, K., Everington, D., Feng, Z. and Dibben, C. (2016) Do young people not in education employment or training (NEET) experience long term occupational scarring? A longitudinal analysis over 20 years of follow up. Contemporary Social Research, 11, 2-3, 202-221. CrossRef link
Reid, H. and Westergaard, J. (2017) ‘Oh I do like to be beside the seaside’: opportunity structures for four un/underemployed young people living in English coastal towns. British Journal of Guidance & Counselling, 45, 3, 341-355. CrossRef link
Roberts, K. and Parsell, G. (1992) The Stratification of Youth Training. British Journal of Education and Work, 5, 65–83. CrossRef link
Roberts, K. (2009) Youth in Transition: Eastern Europe and the West. London: Palgrave.
Roberts, K. (2013) Education to Work Transitions: How the Old Middle Went Missing and Why the New Middle Remains Elusive. Sociological Research Online, 18, 1, 3. CrossRef link
Shildrick, T.A., MacDonald, R., Webster, C. and Garthwaite, K. (2010) The low-pay, no-pay cycle Understanding recurrent poverty. York: Joseph Rowntree Foundation.
Shildrick, T.A., MacDonald, R., Webster, C. and Garthwaite, K. (2012) Poverty and insecurity: Life in low-pay, no-pay Britain. Bristol: Policy Press. CrossRef link
Standing, G. (2011) The Precariat. The New Dangerous Class. London: Bloomsbury.
Strandh, M., Winefield, A., Nilsson, K. and Hammarstrom, A. (2014) Unemployment and mental health scarring during the life course. European Journal of Public Health, 24, 3, 440-445. CrossRef link
TUC (2017) Living on the Edge: Experiencing workplace insecurity in the UK. London: Trade Union Congress.
UKCES (2014) Precarious Futures? Youth Employment in an International Context. London: UK Commission for Employment and Skills.
Watson, I. (2020) The Youth Labour Market: From education to work before and after the global financial crisis. Journal of Industrial Relations, 62, 1, 33-57. CrossRef link
Whittaker, M. (2015) Time to Catch Up? Living Standards in the Downturn and Recovery. London: Resolution Foundation.
Wood, A. (2017) Powerful Times: Flexible Discipline and Schedule Gifts at Work. Work, Employment & Society, 32, 6, 1061–77. CrossRef link