Abstract
Post-industrial regions in England face persistent economic disparities, with Combined Authorities (CAs) central to addressing these through decentralisation. Despite their importance for regional growth, education and skills policies remain centralised, failing to account for geographic variation. This study explores school-to-work transitions using sequence analysis in the South Yorkshire and Greater Manchester CAs. Findings reveal significant challenges for young people in deprived areas, particularly females, those with Special Educational Needs, Free School Meals or low post-16 attainment. Targeted interventions in Further Education colleges at age 18/19 and localised skills strategies are essential to reduce benefit dependency and drive regional economic growth.
Introduction
England has been described as one of the most centralised countries, with significant regional economic disparities compared to other OECD members (McCann, 2023). In 2015, GDP in the north was 18 per cent lower than the national average, contrasting with the south where it was 18 per cent higher (Fransham et al., 2023). This pattern of southern regions outperforming the north can be traced back to 1859 (Martin, 1988). Deindustrialisation in northern areas dominated by coal and steel, coupled with a highly centralised government, has deepened inequalities, leaving particular regions economically ‘left behind’, including the northern ‘Steel City’ of Sheffield (Breach, 2019; Martin et al., 2021, pp. 38-39). A ‘churn’ of regionally focused interventions – including the Regional Development Agencies (1998) and Regional Spatial Strategies (2004) – has failed to deliver long-term change, and regional disparities persist (Fransham et al., 2023).
The Levelling Up Agenda (DLUHC, 2022) was introduced to address geographic economic, social, and health inequalities through twelve missions to be achieved by 2030. It represented the first national strategy in decades to apply an extensive spatial focus and has been described as the most significant spatial policy statement in recent years (Martin et al., 2022; McCann et al., 2023). Combined Authorities (CAs) are recognised as the government’s primary mechanism for devolution and place-based policymaking.
As of 2023, ten CAs exist across England, comprising constituent Local Authority Districts (LADs). Greater Manchester (GM) was the first (2011), followed by South Yorkshire (SY) and others between 2014 and 2018 (Appendix, Figure A1). CAs are voluntarily formed with government approval, enabling participating LADs to pool responsibilities and receive devolved functions designed to promote regional growth through locally driven policy. Their powers include the ability to propose policies and secure additional funding through competitive ‘city deals’ (Sandford, 2023; Paun et al., 2022). The recent revival of CA formation since 2018 demonstrates their growing importance in achieving decentralisation and regional regeneration.
Despite this progress, the Levelling Up Agenda has faced criticism for its limited capacity to tackle entrenched inequalities and for remaining overly centralised and politically driven (Fransham et al., 2023; McCann et al., 2023; Martin et al., 2022; Coyle & Muhtar, 2023). Metagovernance – where central control persists under the guise of devolution – remains a key challenge (Newman et al., 2023). Strengthening the regional knowledge base of CAs is therefore crucial to support robust, evidence-based policymaking and advocate for locally appropriate strategies. International experience suggests that even experimental place-based policies can boost productivity and unlock untapped potential in industrial regions (OECD, 2023).
The Levelling Up Agenda also identified education and skills as central to productivity and regional development (DLUHC, 2022; HM Government, 2025). Investment in education and skills can enhance productivity and improve regional outcomes (Pope et al., 2022). ‘Left-behind’ areas with low productivity often exhibit lower skill levels, creating a low-skills equilibrium where limited job opportunities discourage upskilling and drive the outmigration of skilled individuals (Pope et al., 2022; Dickinson et al., 2022). Ensuring young people remain in education, employment, or training after leaving school is therefore vital for long-term regional growth. Understanding when and where young people experience difficult trajectories – and their typical profiles – offers essential insight for targeted regional policy and prevention.
This paper analyses the pooled school-to-work trajectories of 44,600 individuals from the 2010/11 school-leaver cohort, who were residing in the SY and GM CAs at school-leaving age. It utilises the sequence analysis method through a novel approach by comparing the pathways of young people within the two economically different English CA regions and identifying when and where young people typically experience difficult trajectories into the labour market and their likely individual characteristics. The purpose of the work is to extend the cross-sectional knowledge base of the areas by contributing a longitudinal data-driven analysis to foster more strategic place-based policymaking for regional economic growth. Through this geographical perspective, the paper specifically contributes to existing English regional skills literature and English sequence analysis literature. It should be noted that the analysis in this paper is limited to the first transition into the workforce, rather than longer-term labour market dynamics. It is important to acknowledge that for many young people, subsequent employment experiences are increasingly fragmented and non-linear, reflecting broader shifts towards insecure and atypical work in the UK economy (Furlong & Cartmel, 2007).
The structure of the paper is as follows: First relevant literature is reviewed, followed by the data and sequence analysis methodology used. The results are then presented and discussed. The analysis found when and where young people in SY and GM were most likely to experience a difficult pathway into the labour market, alongside their typical profile. These were young people at age 18/19 after attending a Further Education (FE) establishment and within specific MSOAs that largely mirrored deprived areas. Their profile were typically females, white or mixed ethnicity individuals, those who required Special Educational Needs (SEN), Free School Meals (FSM) or had low post-16 attainment. The final section then concludes.
Literature review
Much like the Levelling Up Agenda, there is an argument that education and skills policy in England is still centralised and ignores the important spatial dimension that is essential for effective place-based policy implementation (Bailey et al., 2023). Corradini et al. (2022) linked place-based policy making with the regional skills landscape and introduced the importance of further education and skills research at a regional-level. Velthuis et al. (2019) found spatial variation was present in the destinations of lower attaining school-leavers within and between CAs, alongside suggesting local post-16 provision affects pathways. Boshoff et al. (2019) investigated the pathways of young people aged 18-24 at local-level who were Not in Education, Employment or Training (NEET) and recommended place-based patterns of inequality requires area-specific support to prevent young people leaving school with low attainment. Additionally, Lupton et al. (2021) reinforced that place matters in lower attainers and argued that regional policy-making in England lacks a robust evidence base to tackle such issues.
Furthermore, Shirt (2021) adopted a bottom-up mixed-methods strategy through local people and stakeholder perspectives to show there were deep rooted socio-economic inequalities present within the city of Sheffield. Amongst the UK and EU cities with a population greater than one million, Sheffield was the lowest performing English city (Forth, 2022). Thomas et al. (2009) highlighted that the topography of Sheffield has contributed to the socio-economic polarisation seen today. Historically, wealthy residents migrated to the west with higher ground and upwind from the pollution produced by the steelworks in the east. They also found that the stark neighbourhood differences between the East and West of Sheffield affected the post-16 destinations of young people. In the East, the 2002-2006 school-leaver cohorts were less likely to continue in education whereas in the West, staying on rates were almost 100 per cent (Thomas et al., 2009, p. 35).
The wider South Yorkshire Mayoral Combined Authority (SYMCA), with Sheffield as its core city, has suffered from persistent low productivity that has limited regional economic growth. The local economy has consistently been trapped in a low-skills equilibrium, where there is a low supply and demand for skills (Dickinson et al., 2022). Education, Skills and Training (EST) deprivation, a subdomain of the Indices of Multiple Deprivation measuring the lack of attainment and skills in the local population, has also remained consistent in SY for at least nine years (Appendix, Figure A10). Youth unemployment, education, training deprivation are amongst the most prevalent issues the current local economy is still facing (Dickinson et al., 2022; KADA, 2023; Etherington & Jones, 2016; Beatty & Fothergill, 2020). In the most deprived Lower Super Output Area (LSOA) in SY, 28 per cent of people had a Level three or above qualification, compared to 79 per cent of people in the least deprived LSOA (SYMCA, 2024). To tackle these issues, the current missions of SYMCA in their first regional Skills Strategy in 2024 are to help those far from the labour market into work, to raise the attainment of core skills and to increase the supply of a highly skilled workforce (SYMCA, 2024).
In contrast, GM has become one of the most thriving and developed CA areas in the north with considerably high economic performance. GM was arguably the world’s first industrial city region (Ravetz, 2000, p. 277) and was the trailblazer CA in England, receiving a great amount of funding and attention in education and skills amongst other sectors (Sandford, 2023). In Greater Manchester Mayoral Combined Authority (GMCA), the total GDP of approximately £88 billion and GDP per head of approximately £30,500 surpassed all northern CA output in 2021. Amongst GMCA’s surrounding CAs, SYMCA had the lowest total GDP of approximately £33.5 billion and the lowest GDP per head of approximately £24,400 (Appendix, Table A1). Although Manchester is the highest performing English city after London, it still lacks in strength compared to other EU cities (Forth, 2022). In the wider GMCA inter-regional socio-economic differences are still present and there is a need for ‘internal’ levelling up. Skills supply analysis showed that GM’s population is lower skilled than the national average, particularly in respect to those without any qualifications (GMESAP, 2022). Certain local authorities within GM also exhibit signs of low-skilled equilibria (GMCA, 2022). Similar to SY, EST deprivation in GM has remained fairly consistent for at least nine years (Appendix, Figure A10) Therefore, like SYMCA, improving educational attainment and understanding pathways into the labour market remains a prevalent interest in the region. The close proximity and industrial heritage of the areas but differing experiences in regional economic development has made them natural comparators (Taylor et al., 1996).
Despite the growing emphasis on devolution, the capacity of CAs to influence regional skills outcomes remains shaped by the centralised nature of England’s education and skills system. While the Department for Education (DfE) retains control over compulsory and much of the post-16 system, devolved powers have gradually expanded through mechanisms such as the Adult Education Budget (AEB), Skills Bootcamps, and Free Courses for Jobs, which focus primarily on adult upskilling and work-readiness (SYMCA, 2024; GM CoC, 2023). These policy levers, available largely to those aged 19 and above, enable CAs to tailor provision to local labour market needs, yet their reach over the 16-18 transition stage remains limited. SYMCA, for instance, has directed devolved skills funding towards addressing low qualification levels and persistent educational deprivation. Complementary initiatives such as the Pathways for Work Commission in Barnsley also target young people not in education, employment, or training, signalling a growing local commitment to linking education and welfare-to-work policy.
Conversely, GMCA’s more advanced stage of devolution and established governance structures have enabled more integrated strategies connecting skills, employment, and economic development. By examining young people’s early labour market pathways across two CAs at different stages of devolution, this paper contributes to the regional skills literature by providing new longitudinal evidence on how differences in local context and policy capacity can influence the school-to-work transitions of young people. Although this paper aims to contribute to the regional skills literature, it is important to recognise that skills development alone is unlikely to be sufficient for driving inclusive regional growth, reflecting wider debates that question the extent to which skills policy on its own can deliver productivity gains (Keep & Mayhew, 2010). Effective skills strategies must operate in tandem with wider policy domains, such as clean energy, transport, health, and housing – as reflected in SYMCA and GMCA’s economic plans (SYMCA, 2022; GM CoC, 2023; GMCA, 2025).
In both CA areas, aggregate and cross-sectional analyses regarding the education and skills landscape are available (KADA, 2023; GMESAP, 2022). However, there is a lack of longitudinal individual-level analysis that tracks the school-to-work trajectories of young people at the CA level. Longitudinal analysis has the power to uncover underlying geographic patterns in pathways that can add to the existing CA knowledge of school-leavers (Sickotra, 2022). Lorentzen et al. (2019) used the longitudinal social sequence analysis method to understand and compare school-to-work trajectories in Nordic countries and found pathways were largely similar across Finland, Norway and Sweden. Due to data restrictions, the authors were not permitted to pool the country level data together. A pooled analysis would have enabled better comparative understanding of the common and diverging pathways that emerged in the countries. Amongst the literature utilising sequence analysis to explore English school-to-work trajectories (DfE, 2020; Dickerson et al., 2023; Anders & Dorsett, 2017; De-Coulon et al., 2017), there are no studies that adopt a geographic lens like Lorentzen et al. (2019) to regionally compare the pathways of young people (Sickotra, 2022).
This paper extends the English regional skills and sequence analysis literature on English school-to-work trajectories by using LEO data to analyse the pooled eight-year pathways of 44,600 school-leavers domiciled in the northern SY and GM CAs. The pooled sequence analysis through a geospatial lens aims to further the longitudinal knowledge that CAs have regarding their young people in order to facilitate more informed data-driven and place-sensitive policymaking. Considering the education and skills issues in both CAs, the focus is particularly placed on those experiencing difficult pathways after leaving school, specifically when and where in the regions this is most prevalent, plus their typical individual characteristics. This approach better facilitates the CA regional priorities, such as SYMCAs mission of helping those far from the labour market into work.
Method
Data
The DfE (2024) Longitudinal Education Outcomes (LEO) data is an ideal administrative dataset for analysing school-to-work trajectories as it connects education, employment and benefits data at an individual level alongside capturing geography. The LEO data has previously been used to investigate education and employment outcomes in the UK to provide many rich insights (DfE, 2020; Boshoff et al., 2019; Anderson & Nelson, 2021; Battiston et al., 2019). However, it has not yet been leveraged using sequence analysis at the CA-level and hence was used for this analysis. Moreover, many LEO studies have typically had a greater focus on graduate outcomes or earnings analyses of those who have already entered the labour market (Battiston et al., 2019; DfE, 2024). Where post-16 trajectories are considered, studies tend to focus on a specific subset of individuals, such as investigating pathways at Level three or below only (DfE, 2020). Therefore, using LEO data also extended existing studies by adopting an alternative perspective defining ‘success’ as being able to enter the labour market after leaving school for all types of individuals in SY and GM.
The analysis followed 44,600 individuals aged 15/16 from the pooled SYMCA and GMCA 2010/11 school-leaver cohort extracted from the LEO data (Sickotra, 2025). This included 29,574 individuals residing in GMCA and 15,026 residing in SYMCA at school-leaving age. Their yearly engagements were analysed at the individual level from their first non-compulsory activity in 2011/12 for eight years until 2018/19, corresponding to ages 16/17 – ages 23/24.
Sequence and cluster analysis
Sequence analysis is being increasingly used in the social science domain to longitudinally investigate school-to-work trajectories (Liao et al., 2022). The studies follow a standard three-stage workflow: sequence analysis to form longitudinal histories of education and employment activities, cluster analysis to algorithmically generate pathway typologies, and then Multinomial Logistic Regression (MLR) to understand the likely characteristics of individuals within these typologies. The method is useful as it allows education and employment periods to be analysed and compared as single entities, which can uncover long-term patterns within post-16 pathways, like when unsuccessful labour market entry occurs.
Hierarchical clustering with Ward’s criterion has been the typical clustering approach used within social sequence analysis (Gabadinho et al., 2011), where Ward’s criterion aims to minimise the within-cluster dispersion. This uses an agglomerative bottom-up approach where each datapoint is classed as a single-entity cluster and clusters most similar based on Optimal Matching (OM) dissimilarities (Appendix) are grouped together iteratively until all data points are cluster-members. An extension to this is the Partitioning Around Medoids (PAM) algorithm which utilises these results as a data-driven input. The PAM method was chosen for this analysis as it provides a more dynamic and flexible approach to cluster generation due to a medoid updating procedure involved. This contrasts to the traditional method, where the clusters formed in each iteration are never split or reassessed (Liao et al., 2022).
The algorithm first starts with an arbitrary set of k sequences to act as initial cluster medoid points. A medoid is defined as the point in the cluster whose OM dissimilarity with all other points in the cluster is minimum. In the first instance, medoids selected through hierarchical clustering are used, after which they are updated in each iteration. The iterative procedure is outlined below (Saket & Pandya, 2016):
- Select arbitrary set of k sequences to act as medoids (selected through hierarchical clustering in the first instance).
- Assign every other sequence object to its closest medoid using the OM dissimilarities to create k clusters.
- Compute the total cost of swapping the existing medoids with every assigned sequence object in the cluster using the OM dissimilarity matrix.
- If any sequence object acts as a better medoid for the cluster by further minimising the OM dissimilarities with all other cluster sequences, swap the existing medoid with the new one.
- If at least one out of k medoids has been updated, repeat from step two until the clustering has stabilised and there is no change in medoids.
A limitation of PAM is that k arbitrary cluster medoids must be specified during initialisation. Therefore, the integrated use of PAM with initial medoids strategically selected through hierarchical agglomerative results optimised the algorithm. k=7 was found as the most optimal cluster number for the pooled SY and GM cohort (Appendix, Figure A7). To explore the sequence and cluster analysis results, the typologies produced were visualised and typology assignment per CA was investigated.
Spatial mapping of school-to-work typologies
The typical three-stage sequence analysis methodology (Liao et al., 2022) was extended in a novel interim stage after cluster analysis. The most ‘prevalent’ school-to-work typologies produced through clustering were mapped per Middle Layer Super Output Area (MSOA) in each of the CAs. Typologies were mapped for 172 MSOAs in SY and 346 MSOAs in GM, with MSOA boundaries correct in 2011. The relative frequency of the most prevalent typology was included to quantify the trajectory dominance. This interim stage was included to extend the CAs evidence-base with knowledge regarding spatial patterns seen within the respective CA and provide insight into specifically where in the region young people were struggling to enter the labour market.
Multinomial logistic regression
To understand the characteristics behind the school-to-work typologies resulting from the cluster analysis stage, MLR was conducted and average marginal effects were produced. The characteristics Gender, Ethnicity, SEN, FSM, General Certificate of Secondary Education (GCSE) attainment, rural/urban classification, Income Deprivation Affecting Children Index (IDACI) (DLUHC, 2015), and the CA name were used as independent predictor variables, with the cluster typologies as dependent variables. These variables were selected based on the LEO variables approved for access and the characteristics used in existing sequence analysis studies (Dickerson et al., 2023). They also reflected issues raised in CA education and skills research (KADA, 2023).
The code for the sequence analysis, cluster analysis and multinomial logistic regression is fully documented and available to use at Sickotra (2024).
Results
Sequence and Cluster Analysis
Figure 1: Sequence index plots showing school-to-work trajectories for the pooled 2010/11 school-leavers (n = 44, 600), split by cluster and ordered by OM distances
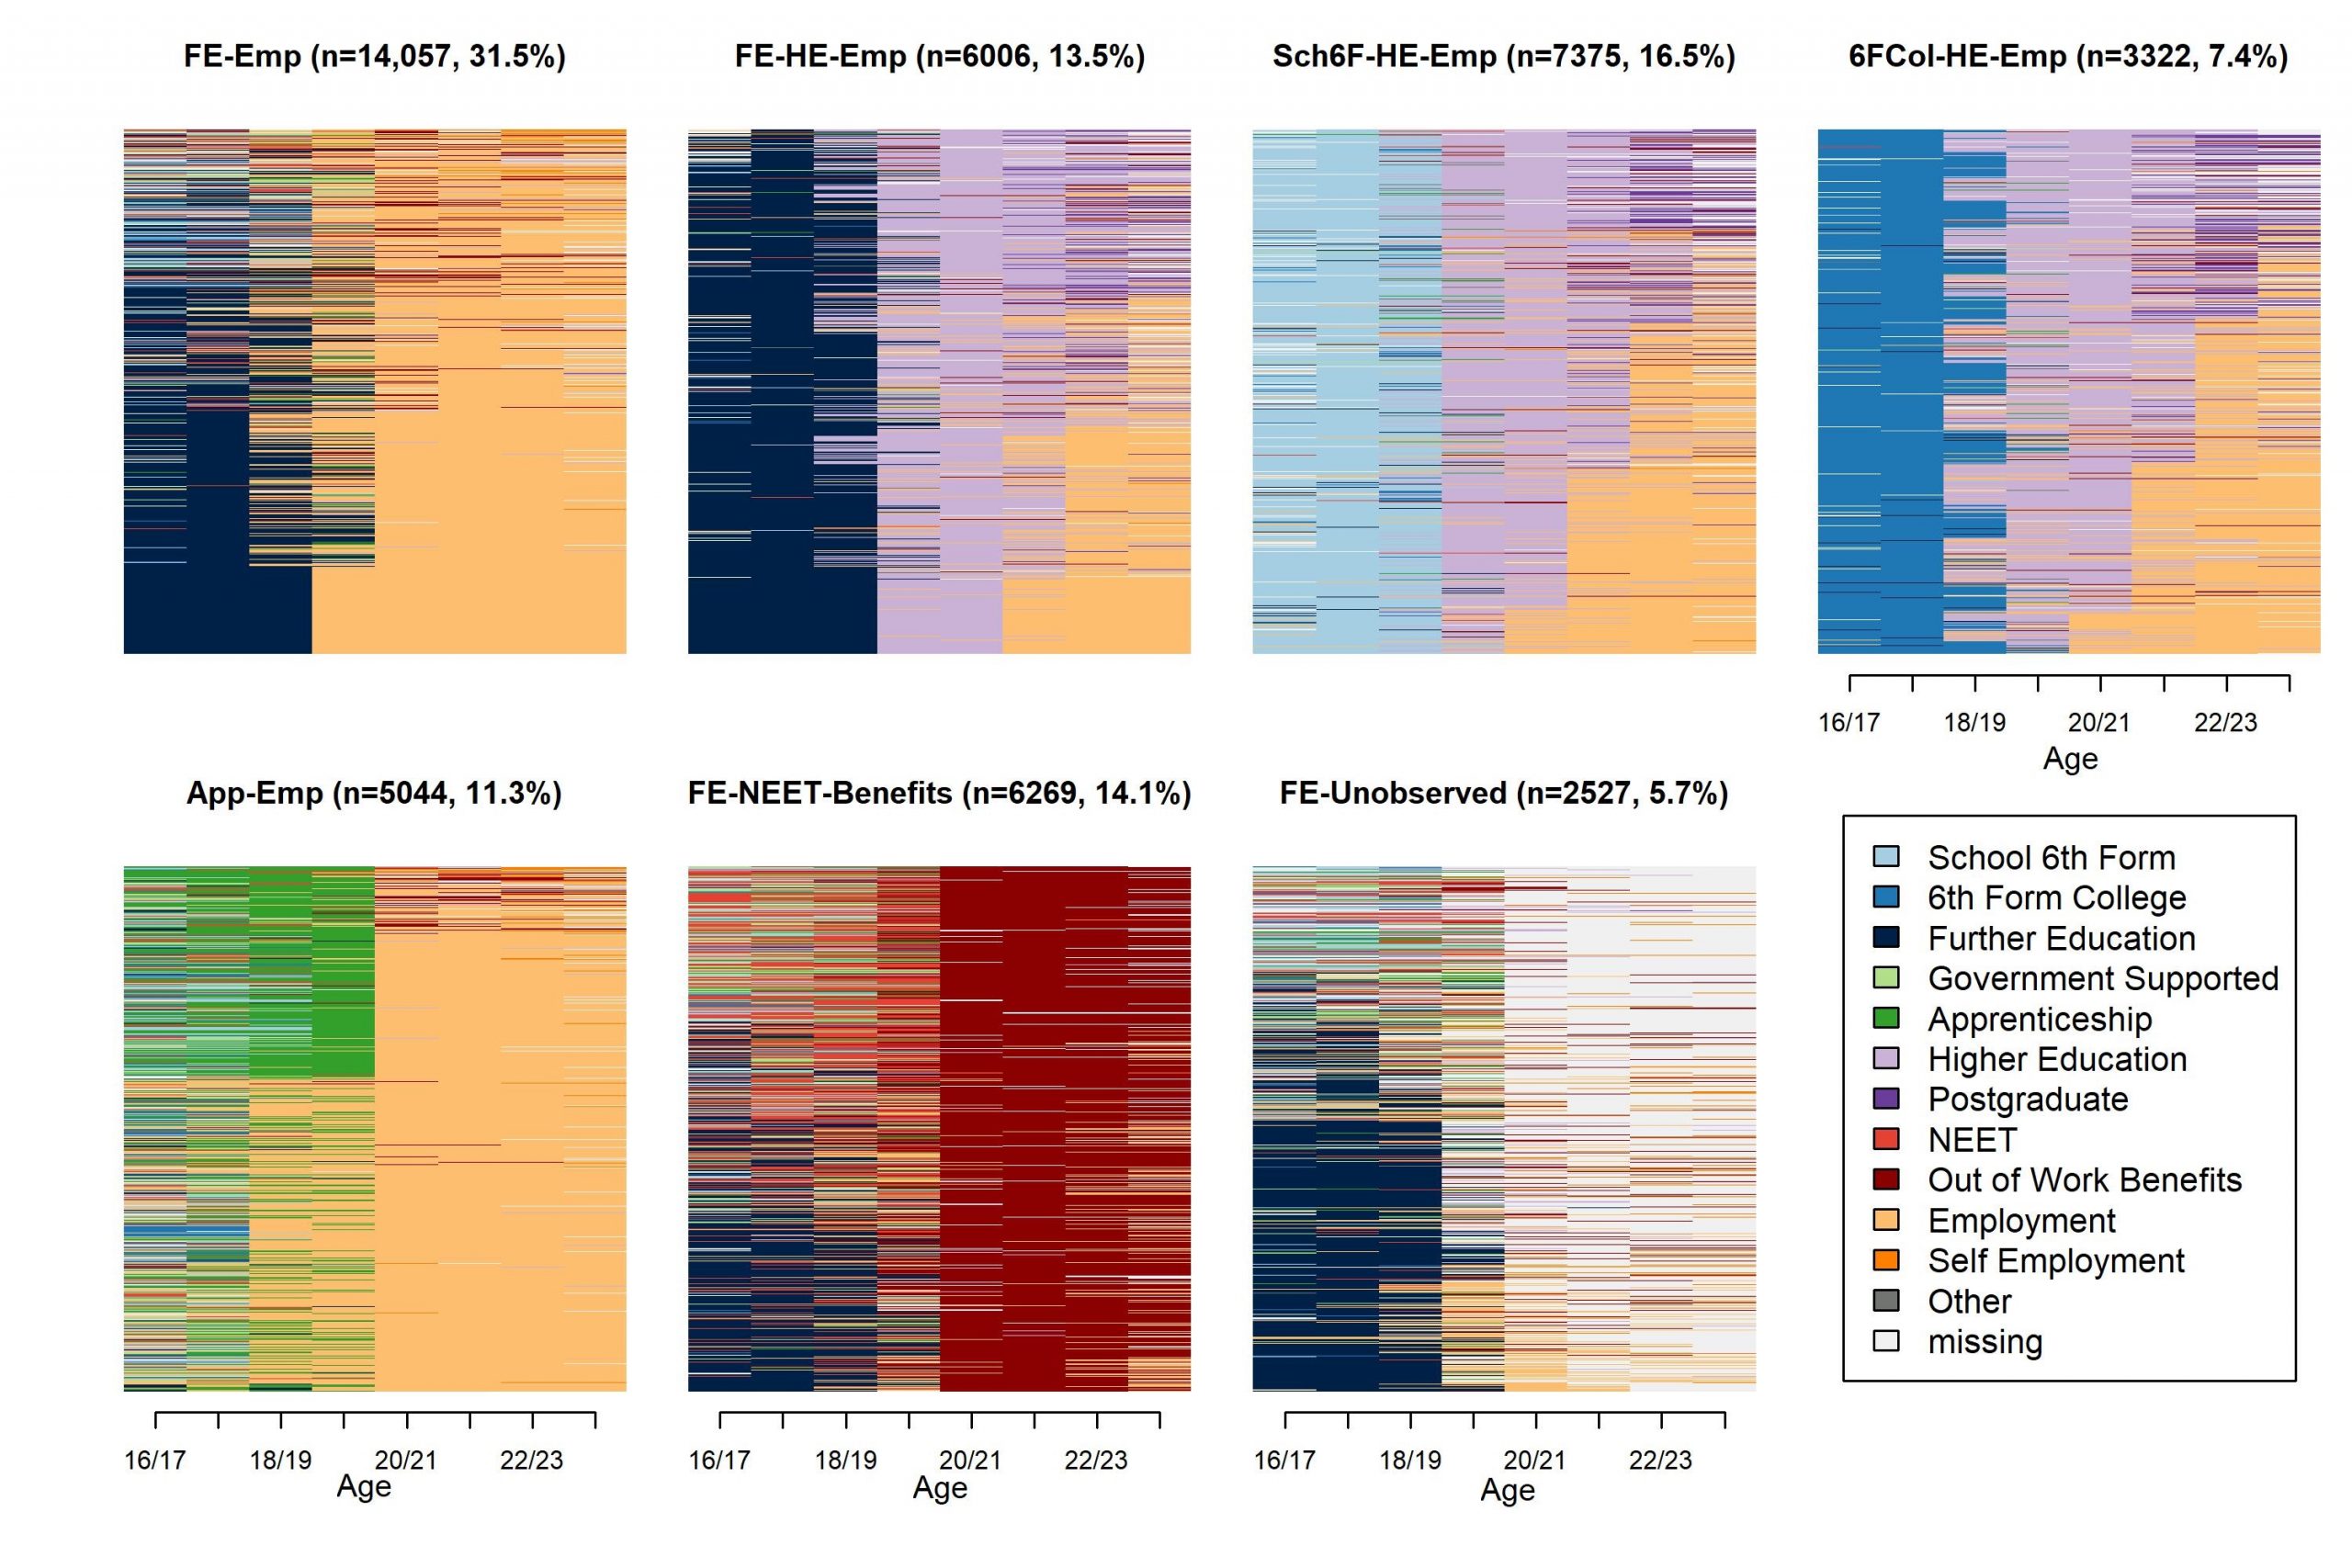
Cluster analysis of the pooled SY and GM 2010/11 school-leaver cohort produced seven school-to-work typologies shown in Figure 1: Further Education-Employment (FE-Emp), Further Education-Higher Education-Employment (FE-HE-Emp), School 6th Form-Higher Education-Employment (Sch6F-HE-Emp), 6th Form College-Higher Education-Employment (6FCol-HE-Emp), Apprenticeship-Employment (App-Emp), Further Education-Not in Education or Employment-Out of Work Benefits (FE-NEET-Benefits) and Further Education-Unobserved (FE-Unobserved). Individuals marked as NEET were officially recorded in the LEO data as not in any form of education or training, those marked as Benefits were individuals officially claiming Out of Work benefits, and those marked as Unobserved were individuals where their status was unknown. These unknown statuses could have included ‘hidden’ NEETs where individuals were NEET or Unemployed but did not claim any Out of Work benefits and so essentially were out of the education and employment system. The cluster labels were used to describe the clusters based on the overall patterns seen within the Figure 1 sequence index plots.
Sequence index plots present the longitudinal activities of every individual, where each row represents one individual. The sequences were ordered by the OM distances for visual clarity (Liao et al., 2022). Reading each sub-plot from left to right follows a young persons’ activities from age 16/17 through to age 23/24. A more detailed breakdown of activity proportions can be seen in Appendix, Figure A8. It should be noted that the Education and Skills Act 2008 increased the minimum school-leaving age from 16 to age 17 in 2013 and to age 18 in 2015. Therefore, this did not apply to the 2010/11 school-leaver cohort in this analysis. The absence of a separate school to direct employment cluster indicated majority of young people chose to continue in some form of education or training rather than directly enter the labour market, despite the minimum school-leaving age still being 16.
The FE-Emp typology had the largest share of 31.5 per cent individuals and the FE-Unobserved typology had the lowest share of 5.7 per cent individuals from the 44,600 cohort members. 11.3 per cent were assigned to the App-Emp cluster. 16.5 per cent and 13.5 per cent of individuals went from Sch6F and FE respectively into Higher Education (HE) and subsequent employment. This was in contrast with the much smaller proportion of 7.4 per cent taking the Sixth Form College route into HE and then employment.
The FE-NEET-Benefits cluster was the third largest containing 14.1 per cent of young people, indicating there were a significant number of individuals who were not successfully able to enter the labour market after school and had to claim long-term out-of-work benefits. Approximately over a half of school-leavers assigned to the cluster began in FE until age 17/18, before becoming NEET and subsequently reliant on Out of Work (OfW) benefits, rather than becoming NEET directly out of school. Although the cluster was labelled FE-NEET-Benefits since this was the majority pathway, the respective index plot in Figure 1 shows variability in the sequences from ages 16/17 to ages 18/19. Many young people undertook government supported training or did become NEET directly after leaving school (Appendix, Figure A8) but in both cases, this also led to a long-term reliance on OfW benefits from age 19/20.
Table 1: Size of Clusters: Pooled and Combined Authority Split
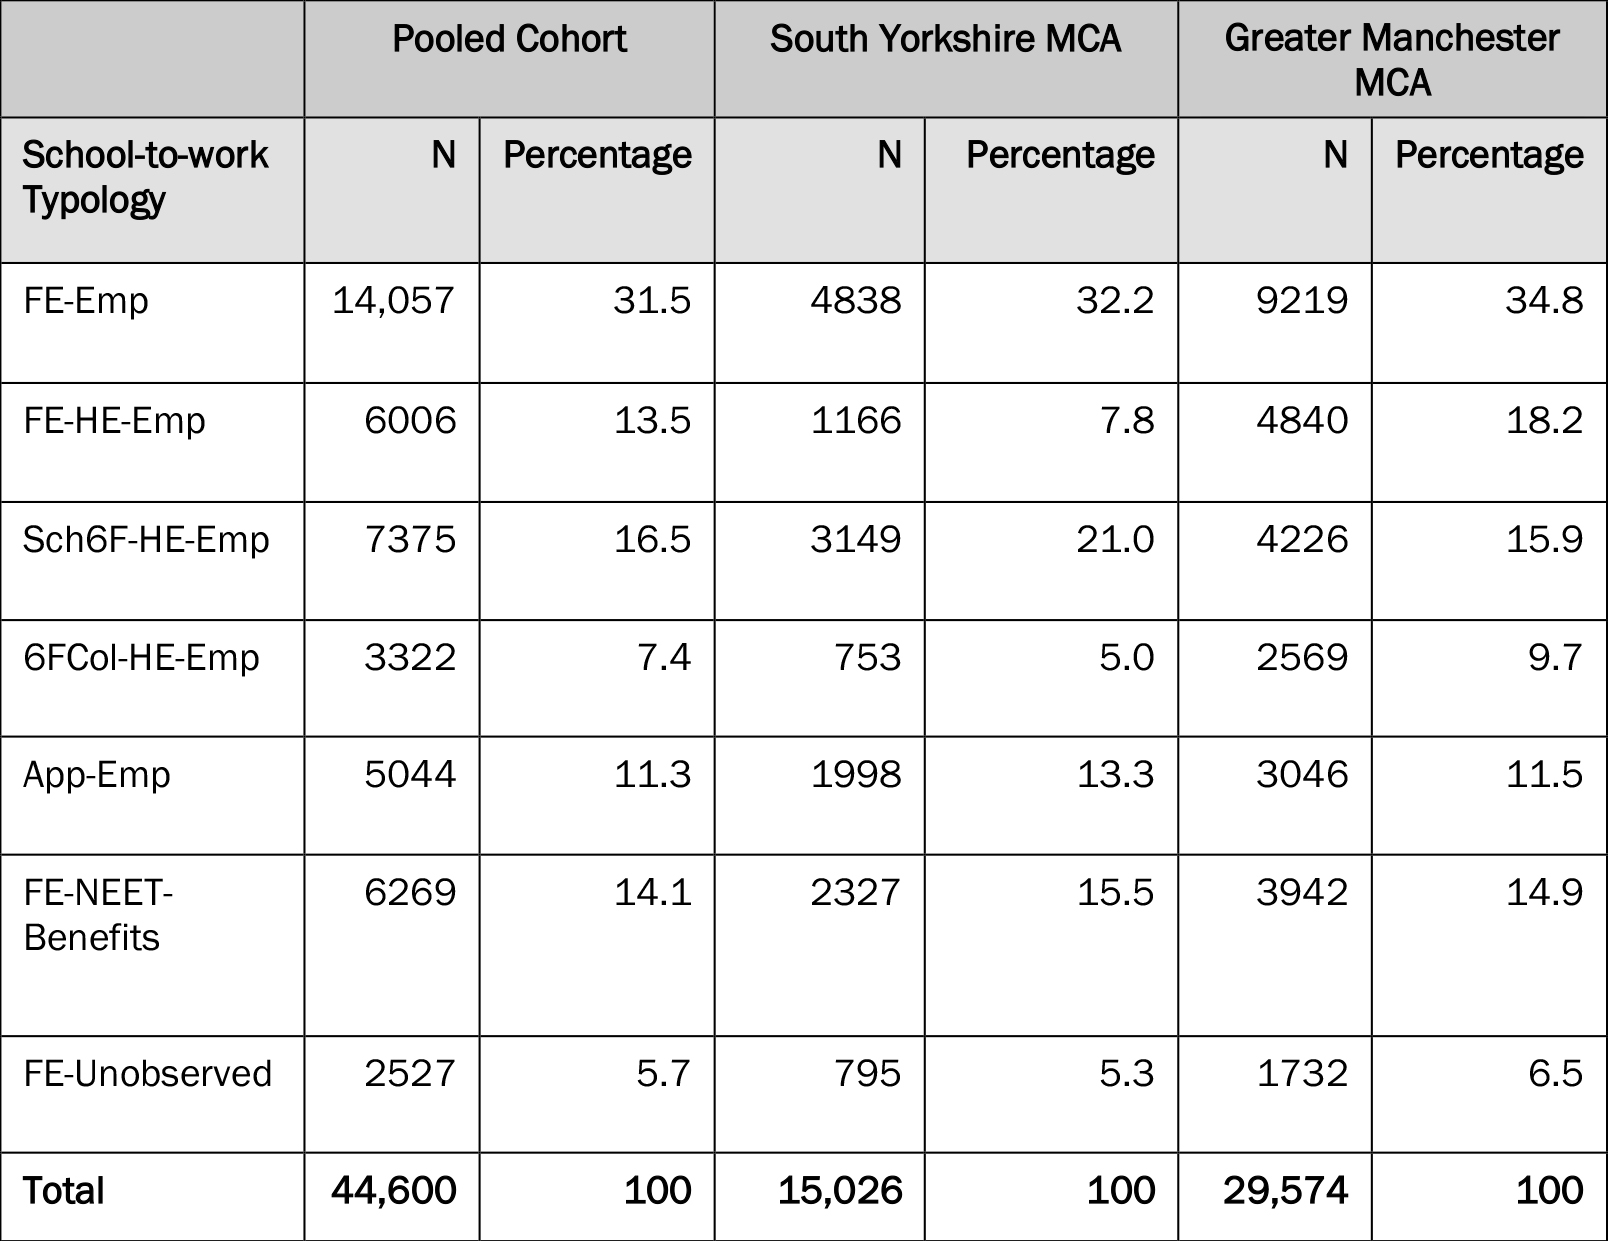
Table 1 shows the composition of young people in the pooled cohort by CA and clustered typology. The FE-HE-Emp typology had the highest percentage point difference of 10.6 between SY and GM domiciled school-leavers, where 18.2 per cent were from GM and 7.8 per cent were from SY. GM also had a higher proportion of individuals assigned to the 6FCol-HE-Emp typology than SY. Contrastingly, SY had a greater percentage of 21 per cent compared to 15.9 per cent in GM assigned to the Sch6F-HE-Emp typology. These differences largely reflect the current 2024 percentage distribution of post-16 education establishment types in SY and GM (Appendix, Figure A9), and likely also reflected the types available to the 2010/11 cohort at the time they left school. From typologies including HE, the total share was ten percentage points higher in GM compared to SY, suggesting young people from GM had an overall greater participation in HE regardless of post-16 establishment type. Moreover, SY and GM had largely similar percentages for the FE-Emp, App-Emp, FE-NEET-Benefits and FE-Unobserved typologies. Both had proportions of 15.5 per cent and 14.9 per cent of young people assigned to the FE-NEET-Benefits typology respectively. This was the lowest percentage point difference compared with all other typology differences and highlights the issue of difficult transitions into the labour market affected both areas equally.
Spatial Mapping of School-to-work Typologies
Figure 2: Most ‘prevalent’ school-to-work typologies in South Yorkshire and Greater Manchester
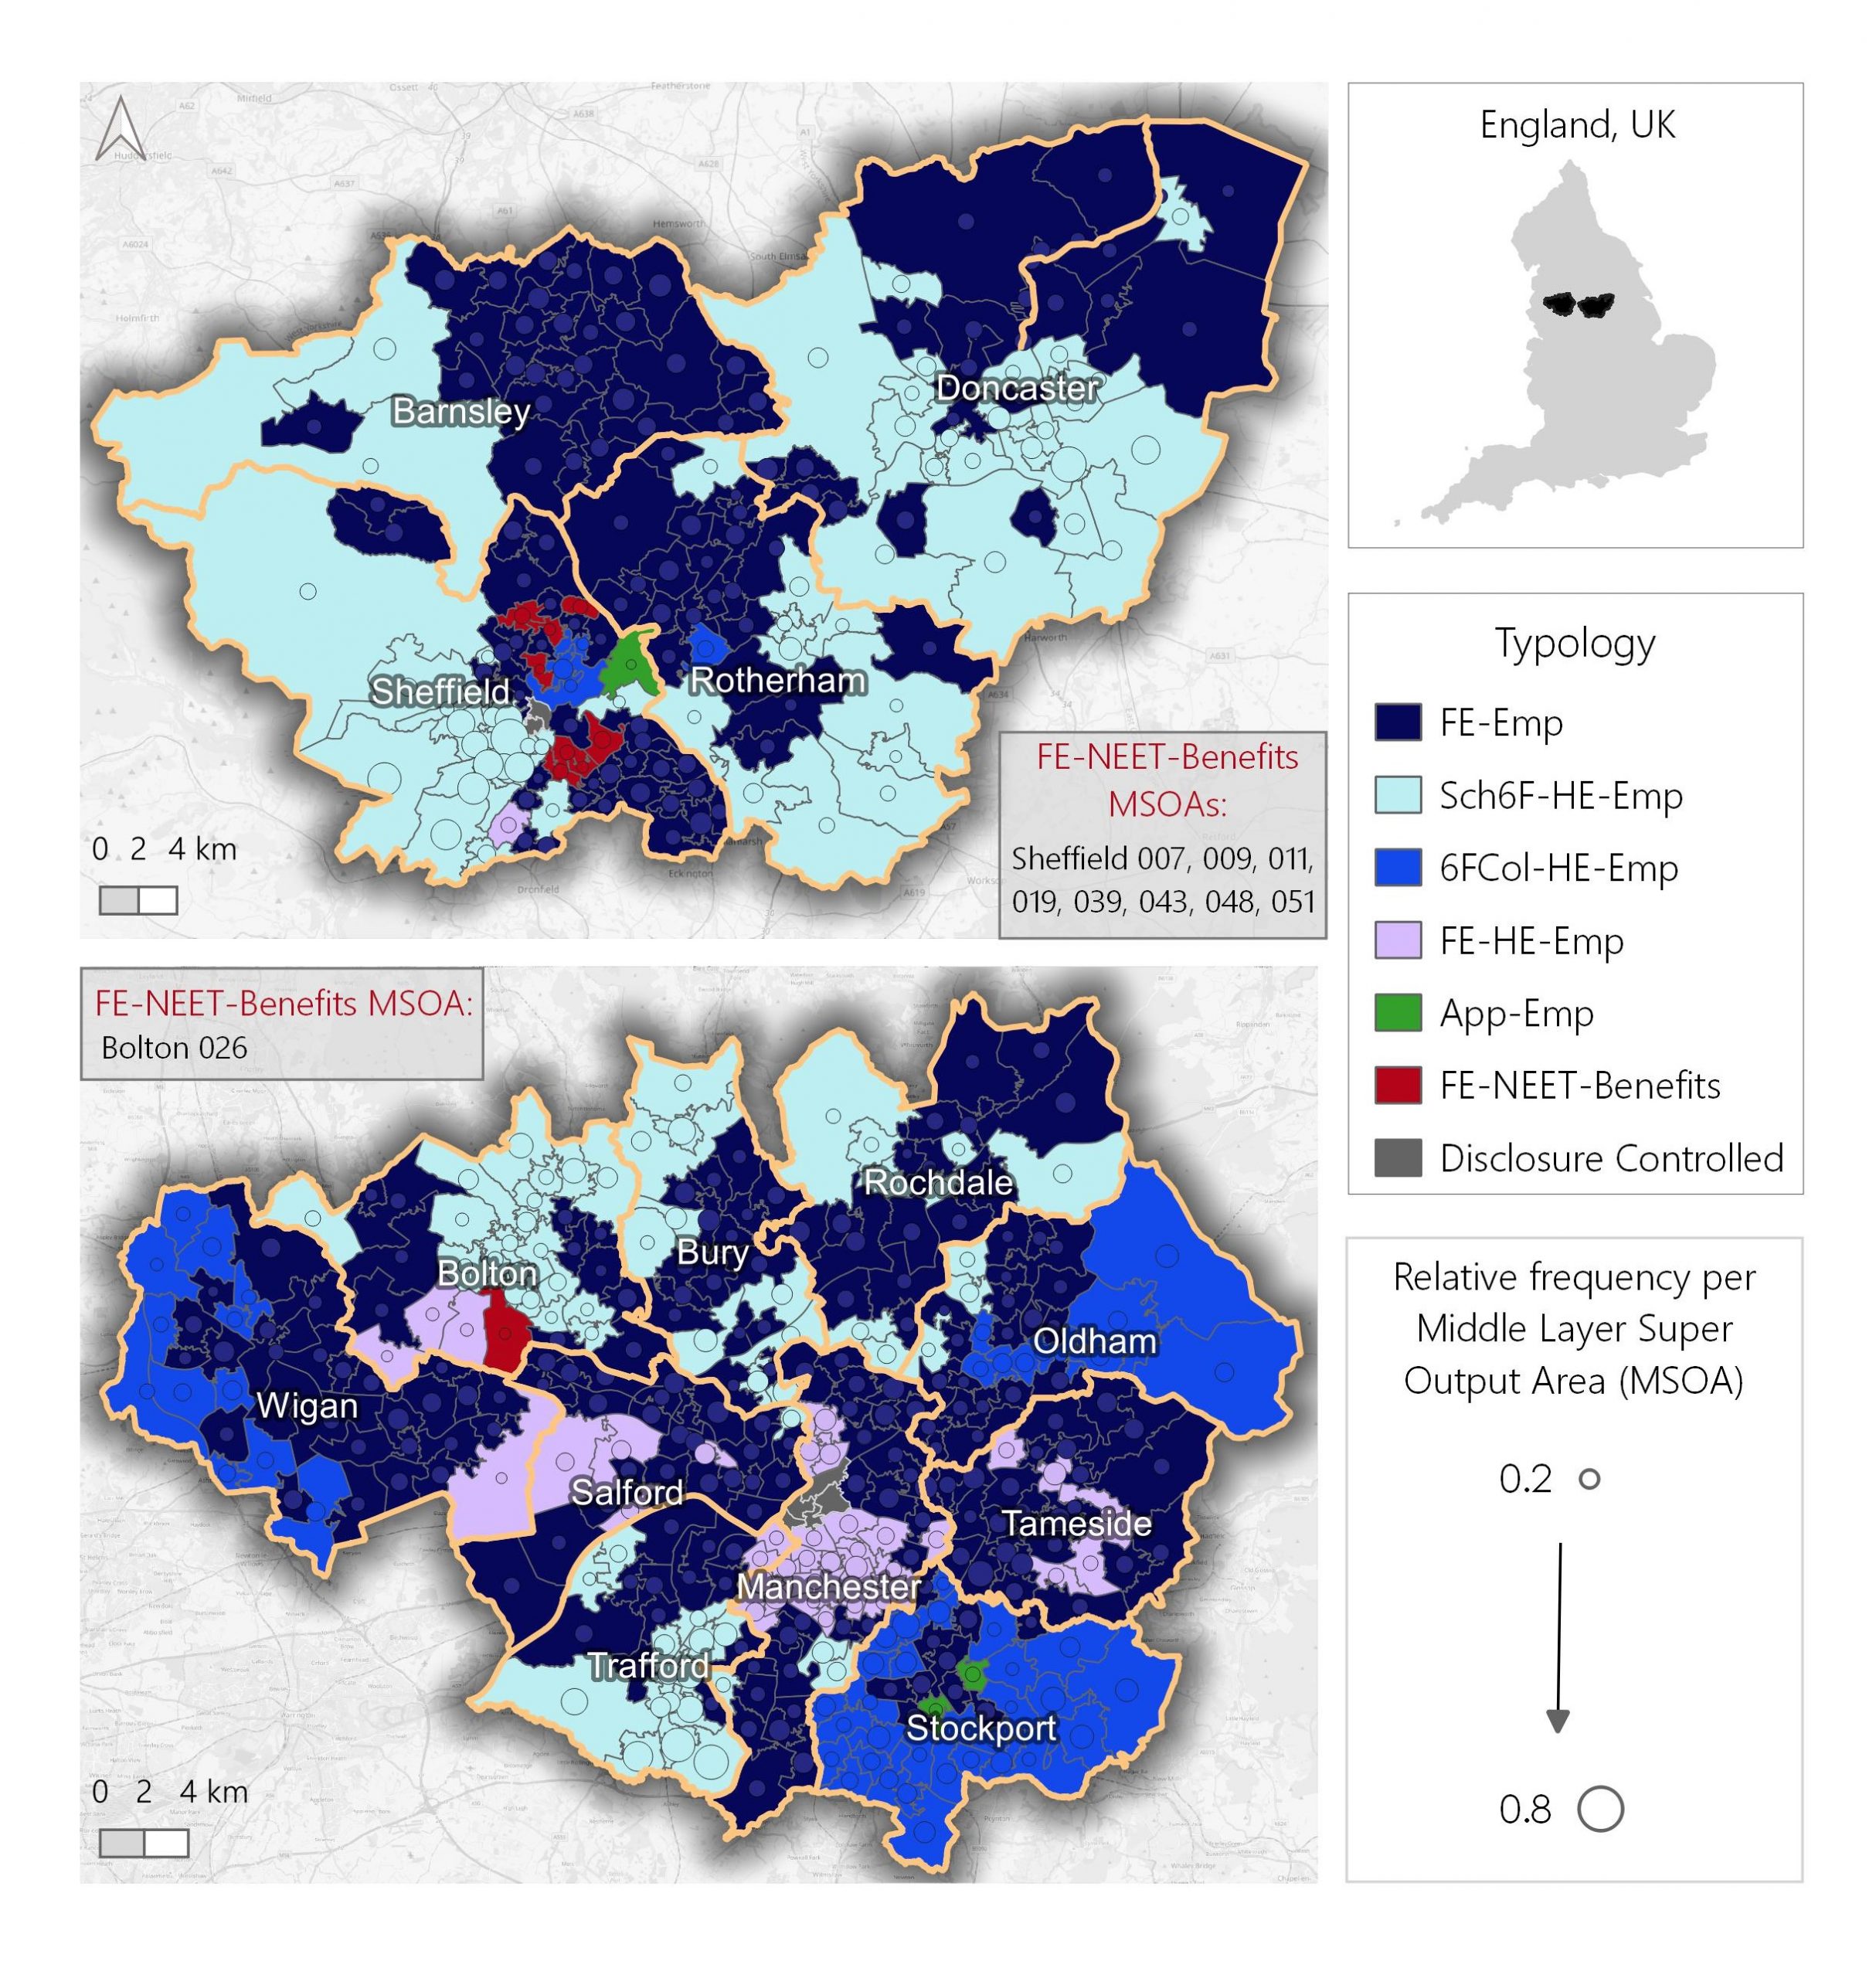
Figure 2 maps the most ‘prevalent’ school-to-work typologies in SY and GM at the MSOA-level resulting from the sequence and cluster analysis. Typologies were mapped where there were at least ten individuals in each MSOA and at least ten individuals per most prevalent typology. Where these criteria were not met, results were marked as disclosure controlled. Ties in the most prevalent typology were resolved by a random draw. The relative frequency of the most common typology observed per MSOA is indicated through circle size. Further details regarding specific counts were not permitted due to data security.
The mapping uncovers underlying spatial patterns between school-to-work typologies across the CAs. Spatial groupings of typologies were more pronounced in SY than in GM, where splits between the FE-Emp and Sch6F-HE-Emp typologies were visible in each SY LAD. The most prevalent typologies followed in GM had greater variation than in SY, with significantly more prominent clusters of 6FCol-HE-Emp and FE-HE-Emp trajectories in GM. The App-Emp typology was spatially concentrated in the CAs and most observed in east Sheffield and in central Stockport.
Furthermore, Figure 2 reveals key MSOA areas in both CAs where majority of young people who left school in these areas experienced an unsuccessful transition into the labour market. The east side of Sheffield revealed the most variation in typologies but had a spatial clustering of eight MSOAs where the FE-NEET-Benefits school-to-work pathway was most prevalent with a relative frequency between 22-38 per cent. In GM there was only one MSOA in the south of Bolton where FE-NEET-Benefit typology was the most observed, with a lower relative frequency of 26 per cent. This showed that unsuccessful trajectories for the 2010/11 school-leaver cohort were more widespread and dominant in SY than in GM.
Figure 3: Relative frequency of the FE-NEET-BEN typology across South Yorkshire and Greater Manchester
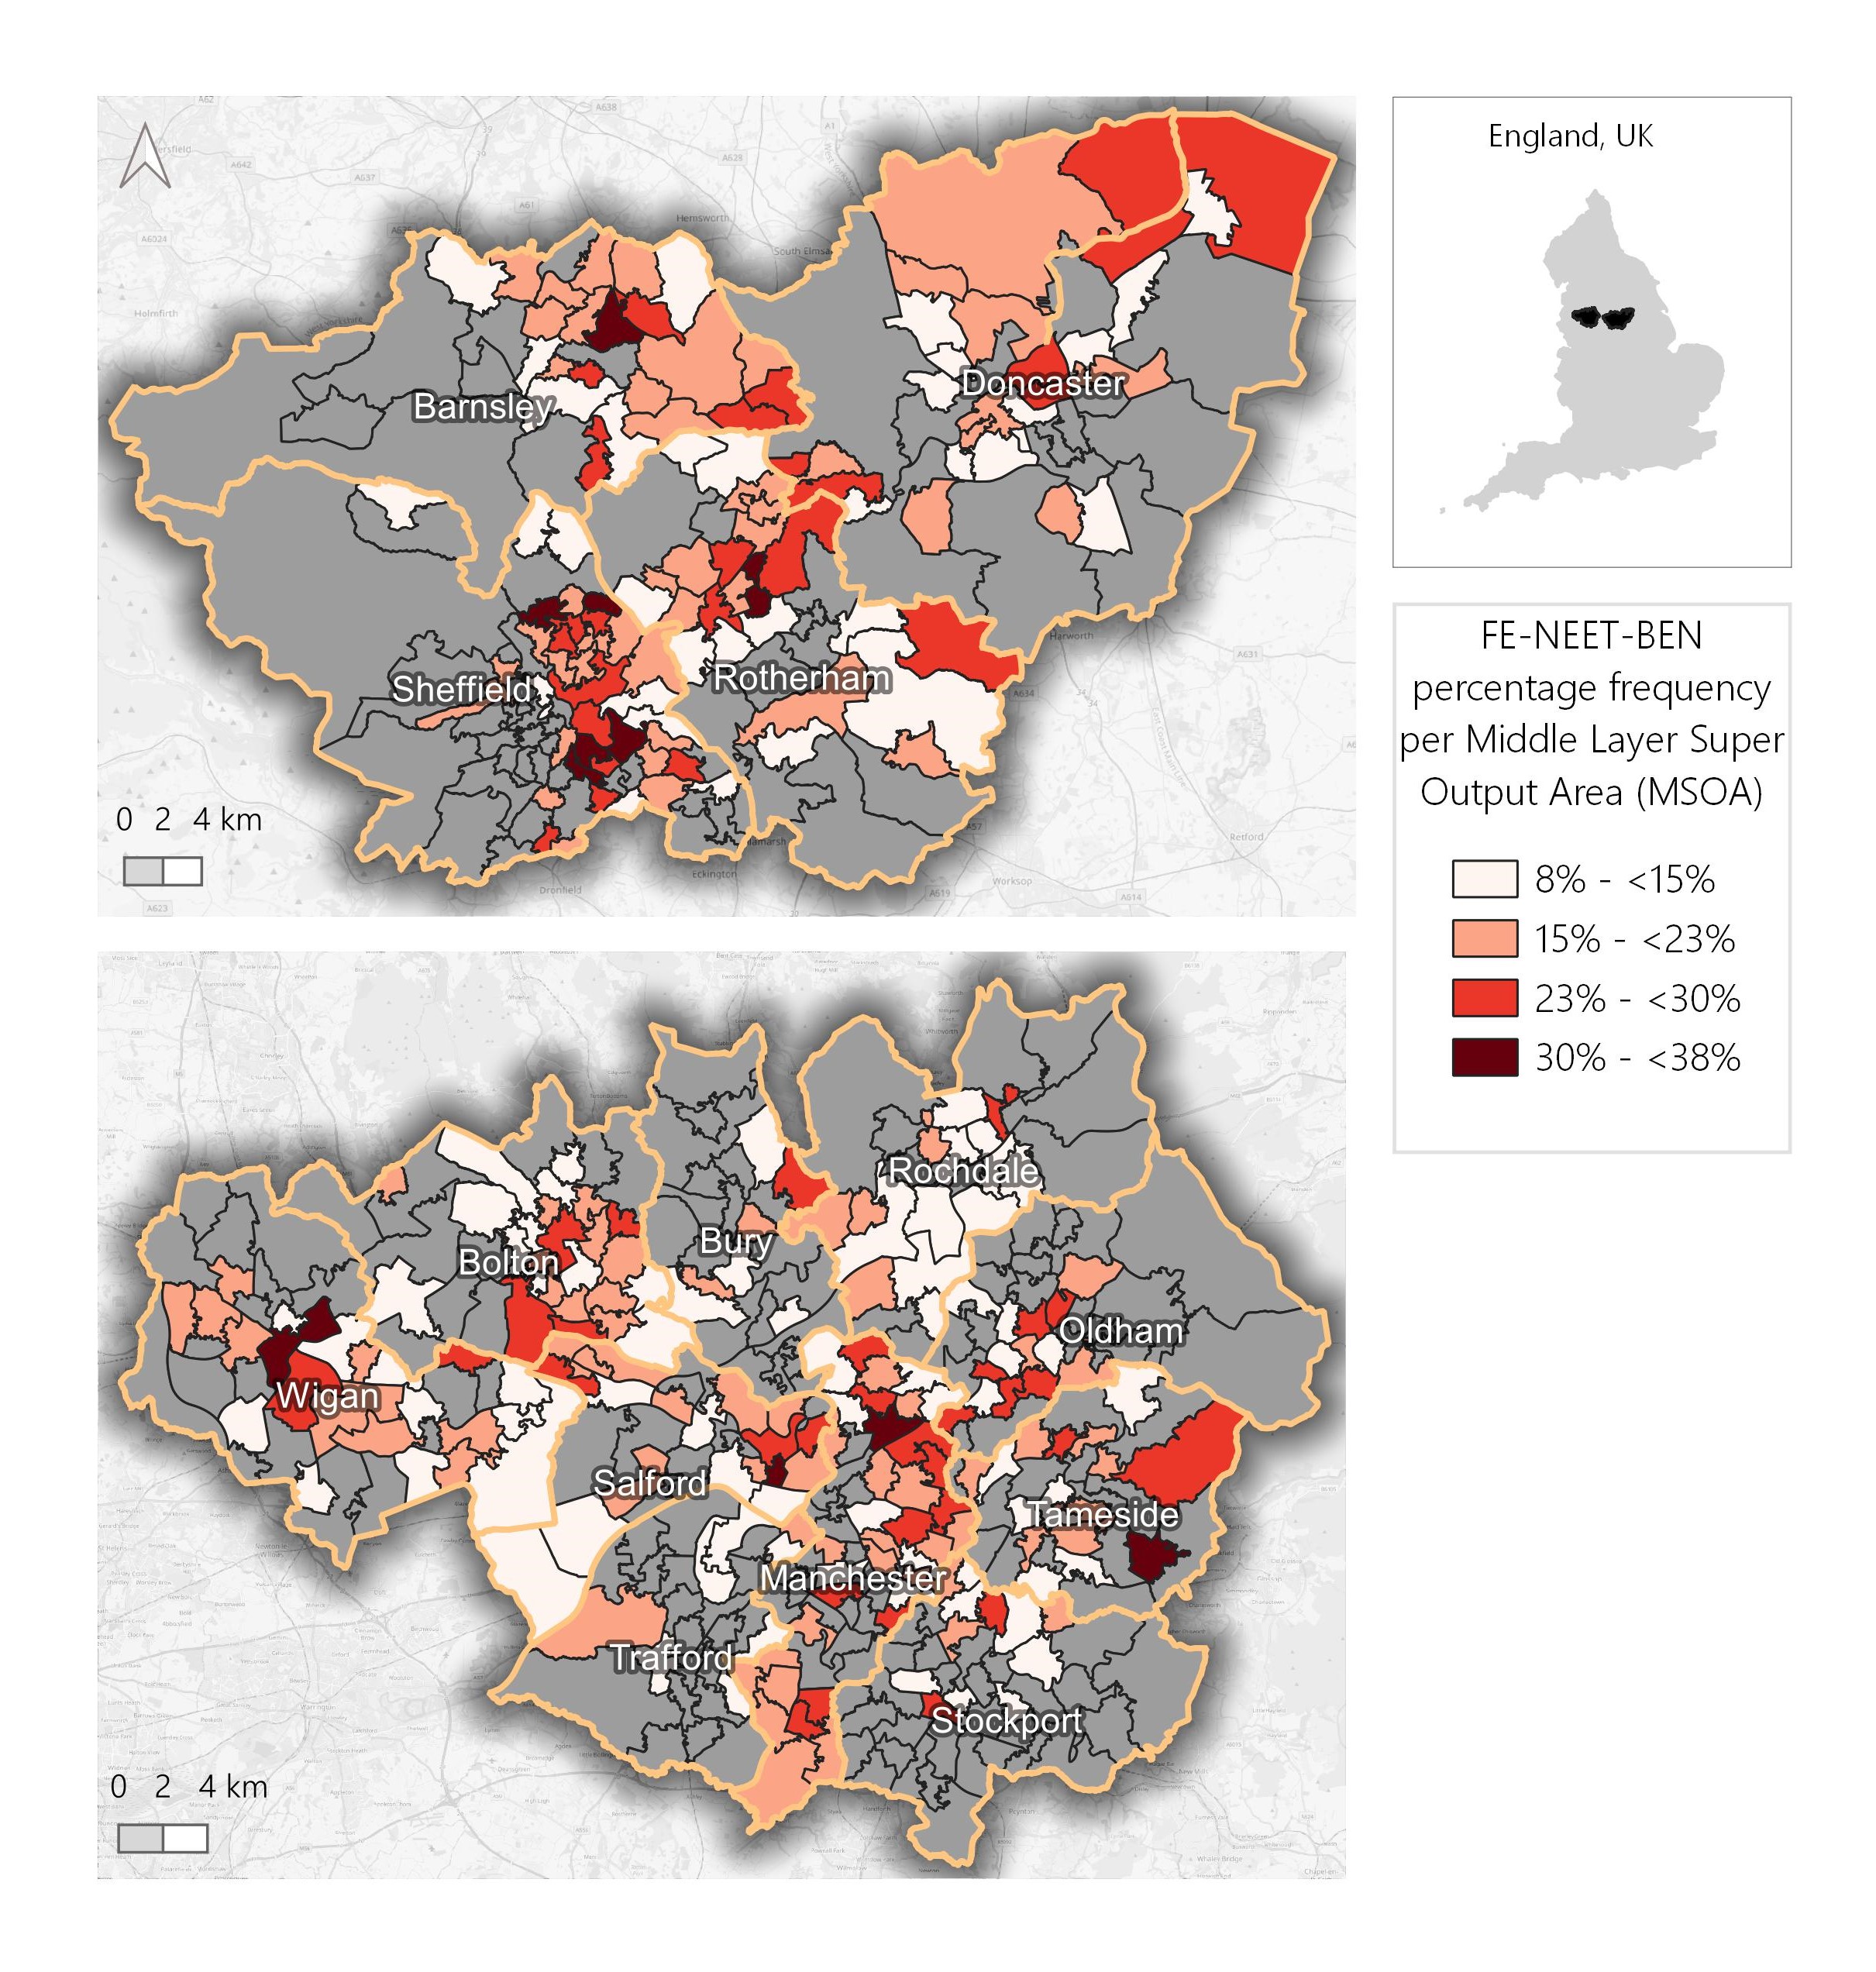
As the focus of this paper is on young people who experience difficulties entering the workforce, the FE-NEET-Benefit typology was then mapped to view the spatial patterns and relative dominance across the SY and GM MSOAs, even where this was not regarded as the most prevalent typology.
Figure 3 presents the percentage of individuals per MSOAs in SY and GM assigned to the FE-NEET-Benefit typology. Data is included where there were at least ten individuals per MSOA and at least ten individuals within the FE-NEET-Benefit typology. There were 176 MSOAs with this typology in GM, equating to 51 per cent of all GM MSOAs, and 108 MSOAs in SY, equating to 63 per cent of all SY MSOAs. There was higher dominance of this typology in five MSOAs in GM, where the relative frequency was between 30 per cent- 32 per cent and in seven MSOAs in SY, where the relative frequency was between 33-38 per cent.
Multinomial Logistic Regression
Table 2: Average Marginal Effects on the Probability to follow particular School-to-work typologies
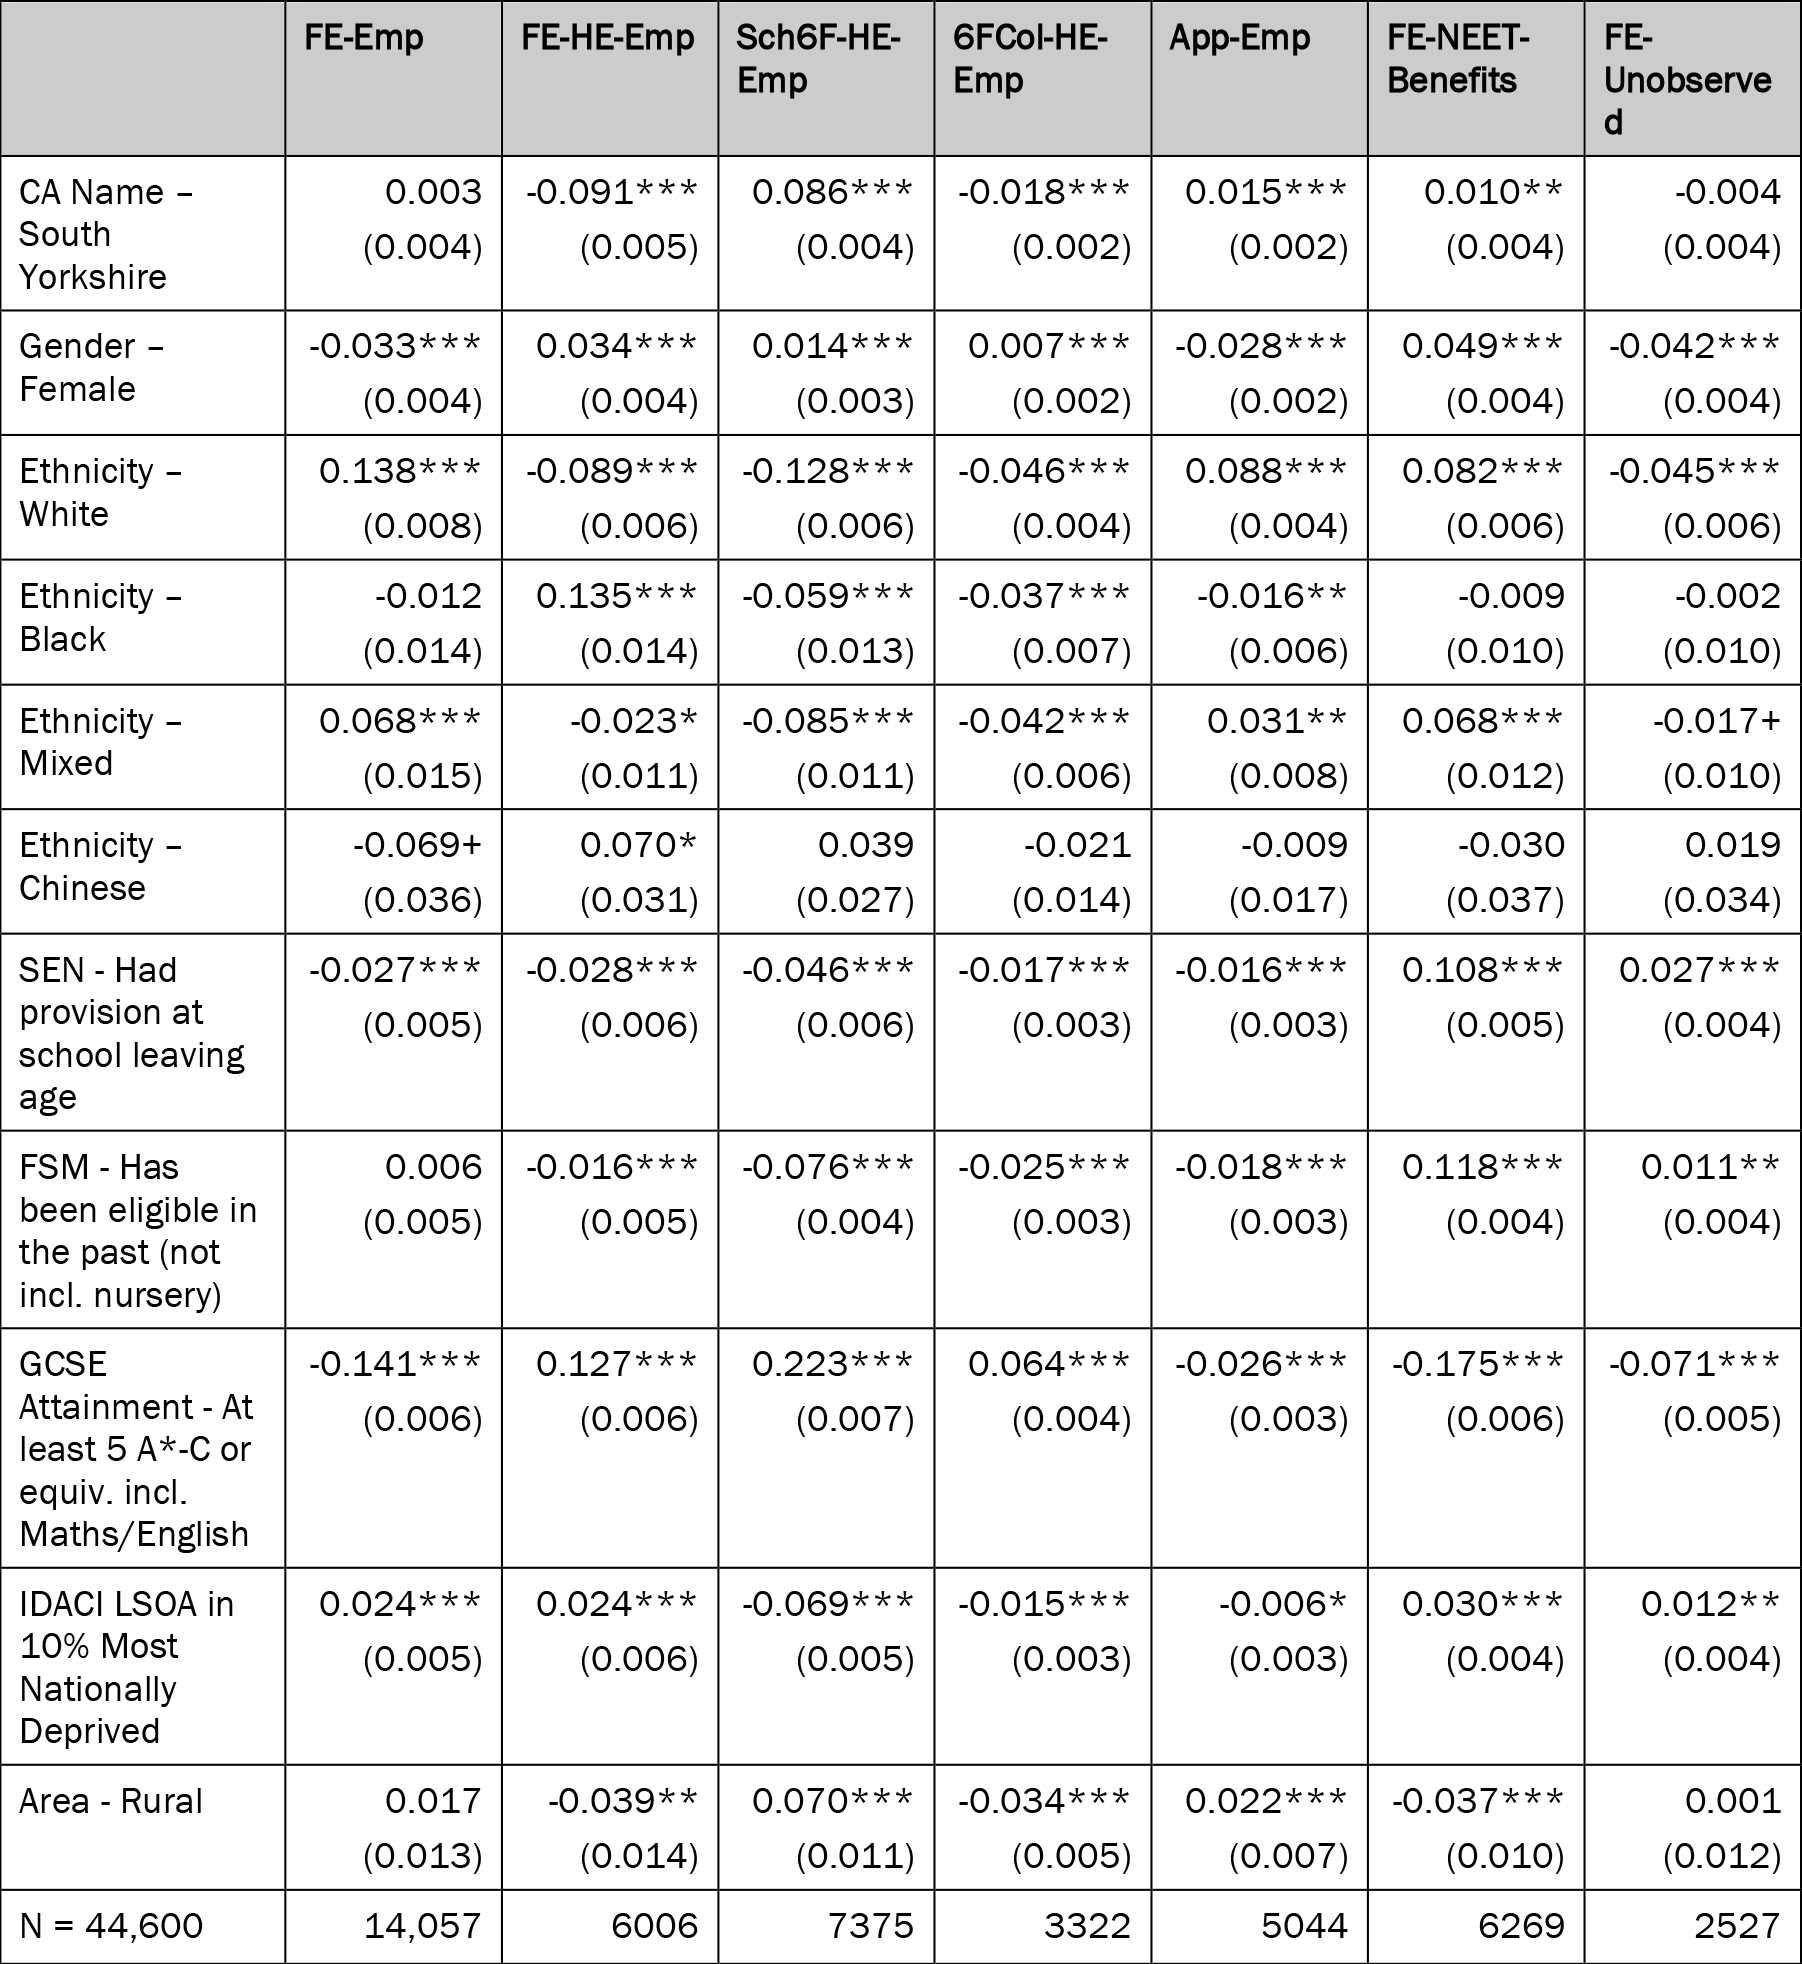
Note: The omitted reference for ethnicity is Asian. ‘Unknown’ and ‘Other’ Ethnicity was included in the model but has been omitted. Standard Errors reported in parentheses. Stars indicate statistical significance: + p≤0.1, * p≤0.05; ** p≤0.01; *** p≤0.001.
Table 2 presents the average marginal effects on the probability to follow a particular school-to-work typology using individual characteristics. The purpose of the MLR analysis was to better understand the characteristics of those likely to fall into the FE-NEET-Benefits typology. All variables used were found as significant in predicting the typology an individual was likely to follow and so the magnitude of effects are discussed. Particularly Gender, Ethnicity, SEN and GCSE attainment were of greater significance.
Young individuals domiciled in SY were only one percentage point more likely to follow a FE-NEET-Benefits trajectory than GM ceteris paribus, supporting that both CA are equally at risk of school-leavers experiencing difficult trajectories. It was also found that these difficult trajectories were more likely to occur in urban areas than rural areas and in places where IDACI deprivation was higher. Females were 4.9 percentage points more likely to follow the FE-NEET-Benefits typology than males, white or mixed ethnicity were 6-8.5 percentage points more likely to follow the typology than their non-chinese Asian counterparts and young people who had SEN provision at school leaving age or were FSM eligible in the past since nursery were 10-12 percentage points more likely to have a difficult trajectory compared to their respective counterparts. Those without at least five A*-C GCSEs or equivalent including Maths and English were also significantly more likely to require support through long-term benefits. There was an almost an equal likelihood of school-leavers from areas within the ten per cent most nationally IDACI deprived to follow either the FE-Emp, FE-HE-Emp or the FE-NEET-Benefits. Moreover, based only on the region, Table 2 shows those from GM were significantly more likely to enter HE after FE than those from SY.
Discussion
There is a lack of longitudinal knowledge on school-to-work trajectories in SYMCA and GMCA and sequence analysis techniques have yet to be applied from a regional perspective. This paper addressed this gap by utilising the sequence analysis method through a novel geospatial approach by comparing the pathways of young people within the two CA regions. It analysed the pooled school-to-work trajectories of 44,600 individuals from the 2010/11 school-leaver cohort, who were residing in SY and GM at school-leaving age, to extend the longitudinal evidence-base of the CAs.
Cluster analysis produced seven school-to-work typologies using education and employment sequences and uncovered the overarching patterns in SY and GM. The FE-NEET-Benefits typology was assigned to those who experienced difficult trajectories into the labour market and were reliant on long-term OfW benefits. The clustering helped to indicate young people were more likely to experience unsuccessful trajectories at age 18/19 after participating in FE rather than becoming NEET directly after leaving school. This could indicate a potential intervention point at age 18/19 where CAs have increased levers through the Adult Education Budget (DfE, 2023) to prevent young people from becoming NEET or reliant on long-term benefits.
The spatial variation of school-to-work typologies in SY and GM, seen through mapping the most prevalent pathway per MSOA and the size of the clusters within each CA, largely reflected the post-16 education establishments currently available. The typologies were compared with the current CA post-16 establishments as data correct in 2011 were incomplete (GOV.UK, 2024). Nevertheless, this suggests local post-16 provision affects the pathways of individuals, supporting the analysis by Velthuis et al. (2019) and Dickerson & McIntosh (2013). Moreover, the prevalence of the FE-NEET-Benefit typology in the east of Sheffield aligned with the deprivation division found between the wealthiest western and poorest eastern areas of Sheffield (Thomas et al., 2009). The higher relative frequency of the FE-NEET-Benefit trajectory compared to GM showed the problem of unsuccessful pathways was more spatially concentrated with higher dominance in SY. The results also supported Boshoff et al. (2019) and Lupton et al. (2021), which found place matters in lower attainers and that place-based patterns of inequality exist for NEETs, signalling area specific support is required.
Similar percentages of the FE-NEET-Benefit cluster in each CA highlighted the issue of unsuccessful trajectories affected both areas equally, reinforcing the work by GMESAP (2022). Although only one MSOA in GM had FE-NEET-Benefits as the most prevalent typology compared to SY with eight MSOAs, Figure 3 revealed difficult trajectories were still a large problem across GM. Patterns of the FE-NEET-Benefit typology in Figure 3 as well as where FE-Emp was most prevalent across SY and GM MSOAs in Figure 2 appeared to closely match areas where there was higher EST deprivation in the regions (Appendix, Figure A10). Since unsuccessful pathways began with FE, other typologies following FE should also be considered. There were four potential pathways a young person could follow after FE: FE-NEET-Benefits as discussed, FE-Emp, FE-HE-Emp and FE-Unobserved.
The FE-Unobserved cluster consisted of individuals who were mainly in FE and from age 20/21 largely had missing activities data. This may have been because the employment data available in LEO excluded low-income individuals who earned below the minimum tax threshold if they worked for a smaller employer (DfE, 2019), meaning some individuals who may have been employed but were on low-pay and did not claim any OfW benefits were not represented in the analysis. Missing activities could also be due to refusal to disclose, death or moving abroad (Sickotra, 2025). Moreover, there is a possibility that some young people were ‘hidden NEETs’. This refers to school-leavers to young adults aged 24 who are out of work, yet do not claim any OfW benefits (Wrigley, 2017). Therefore, they are not recorded in the education or benefits administrative systems and effectively remain undetected.
Results from the MLR found there was almost an equal likelihood of school-leavers from areas within the ten per cent most nationally IDACI deprived to follow either the FE-Emp, FE-HE-Emp or the FE-NEET-Benefits. This supports that deprivation in the local areas prior to school-leaving age has an impact on a young persons’ trajectory, but wider regional factors or conflating barriers meant they could either experience a successful or an unsuccessful transition into the labour market following FE. Therefore, although the FE-NEET-Benefits typology is the most important to prevent unsuccessful trajectories, the FE-Emp and FE-HE-Emp are also important. Since raising the attainment of school-leavers is also a goal in the CAs (SYMCA, 2024; GMESAP, 2022), interventions to aid the transition from FE into HE, particularly in SY where HE was significantly less common than in GM, could benefit the local labour market whilst preventing unsuccessful trajectories.
Overall, the results of the sequence analysis provided essential longitudinal knowledge CAs can utilise to generate informed data-driven and place-based policymaking to improve school-to-work trajectories. The analysis found when and where young people in SY and GM were most likely to experience difficult entry into the labour market, alongside their typical profile. These were young people at age 18/19 following FE participation within specific MSOAs that largely mirrored EST deprived areas. Their profile were typically females, white or mixed ethnicity, those who had SEN provision at school-leaving age, were ever eligible for FSM and those who did not have at least five A*-C GSCEs or equivalent including Maths and English. Since the skills landscape and EST deprivation have remained consistent since the sample cohort (Appendix, Figure A10), especially in SY which has been trapped in a persistent low-skills equilibrium (Dickinson et al., 2022), there is a high likelihood of future school-leaver cohorts from the identified MSOAs to also experience difficulties entering the labour market and become dependent on OfW benefits. To help future cohorts, SYMCA and GMCA should focus on targeting overall education and skills development in the identified local areas when young people are age 18/19, plus FE-specific interventions to prevent NEET and reliance on OfW benefits by increasing HE participation or facilitating employment.
Limitations
Since the activity states were in a yearly format, any period in HE, employment or benefits assumed the respective state for the full year. However, the hierarchy used to integrate the different activity states corrected some of the inaccuracies (Sickotra, 2025). Within the App-Emp cluster, there was a sharp transition from apprenticeships to employment at age 20/21 in 2015/16, since apprenticeships were classed interchangeably as employment in LEO. Hence, it is suspected that many individuals continued their apprenticeships after age 19/20 but were indistinguishable from the employment activity.
Additionally, the LEO employment data excluded low-income individuals earning below the minimum tax threshold if they worked for a smaller employer (DfE, 2019) and so these individuals were not present in the analysis. There was also no ‘unemployment’ activity state available to distinguish between individuals who were unemployed and not claiming OfW benefits in LEO. These cases were likely grouped into the ‘Unobserved’ alphabet category. Another key limitation was that the geography of young people was not tracked and so young people who moved away from SY or GM after school-leaving age is not known. Analysis was attempted to track the geography of individuals but the data available was insufficient for rigorous results and so this detail was omitted from the paper.
Future Research
To extend this paper, detailed investigation into the reasons behind why difficult trajectories were present in certain areas of SY and GM could be explored, particularly from a deprivation and neighbourhood effects perspective (Chetty & Hendren, 2018; Galaster & Sharkey, 2017). This would complement the understanding of when, where and who are likely to struggle to enter the labour market. Future research could also investigate why HE is more likely in GM than in SY. A causal analysis could provide more nuanced insight into factors that may affect this, such as transport links, the number of HE institutions, the type of post-16 establishment attended alongside neighbourhood effects (Patias et al., 2021). Local area fixed effects using MSOA data could also be investigated to account for the influence of deprivation across the dataset. These both could lead to more specific place-based policy interventions to raise skills attainment and prevent unsuccessful school-to-work trajectories. The regression analysis could be extended to include additional local area characteristics, such as unemployment rates, workplace density, and geographical proximity to education and training providers, to provide a more comprehensive explanation of patterns of education participation and progression. Incorporating these contextual factors would further illuminate how transport accessibility and local deprivation shape unequal opportunities, thereby identifying potential areas for policy intervention by Combined Authorities.
Furthermore, the school-to-work trajectories for multiple cohorts could be analysed using sequence analysis to understand whether the results found were cohort-specific. The LEO Iteration two (ONS, 2023) now includes data up to 2021/22 which could be used to create activity histories for later cohorts. Although this paper’s purpose was to understand difficult trajectories into labour market, the LEO Iteration two also includes data on employment sectors which could be used in conjunction with earnings data to further the longitudinal knowledge of successful trajectories in the regions. Moreover, a study comparing the school-to-work trajectories in all English CAs regions, utilising the data and methods deployed in this paper, is also recommended to contribute to regional skills literature.
Conclusion
England has been one of the most centralised countries amongst OECD members with stark regional economic disparities. Post-industrial regions like SY have been economically ‘left behind’ as a result. The Levelling Up Agenda, although controversial, was the first national strategy to have a major spatial focus. It publicised the geographic socio-economic inequalities and highlighted the need for more place-sensitive approaches. Currently, CA organisations are the primary means to achieve decentralisation and rebalance the nation’s economic discrepancies, making CA geographic boundaries increasingly important to consider.
Education and skills play a key role in advancing regional economic growth. Ensuring young people remain in some form of education, employment or training after leaving school can increase the overall regional skills level in the long term. It has been argued that education and skills policy in England is also centralised in nature and lacks spatial nuance despite geographic variations. For example, SYMCA has persistently suffered from a low-skills trap and low regional economic growth whereas GMCA has developed into the highest performing CA in the north of the country, though still lower in strength compared to other EU cities.
Although aggregate and cross-sectional analyses regarding the education and skills landscape in SYMCA and GMCA are available, there is a lack of longitudinal knowledge on school-to-work trajectories in the regions. Understanding longitudinal patterns in areas is important particularly at the CA-level since this is where devolution is focused and where place-based policies can be targeted. Existing literature uses sequence analysis to investigate English school-to-work trajectories but does not adopt a geographic lens like Lorentzen et al. (2019) to regionally compare pathways. Therefore, this paper extended the English regional skills and sequence analysis literature by analysing the pooled eight-year pathways of the 2010/11 school-leaver cohort from SYMCA and GMCA. Focusing on young people who experienced a difficult pathway into the labour market, this paper provided insight on when, where and who struggles after leaving school, adding to the longitudinal knowledge base of the CAs.
Sequences from the education and employment activity histories for 44,600 cohort members were created using the LEO data. Cluster analysis to group these sequences into typical school-to-work pathways produced seven different typologies and helped to identify when unsuccessful trajectories occur. The typologies generated were FE-Emp, FE-HE-Emp, Sch6F-HE-Emp, 6FCol-HE-Emp, App-Emp, FE-NEET-Benefits and FE-Unobserved. A unique interim stage in the sequence analysis workflow mapped the typologies across MSOAs in the CAs to provide insight into where the FE-NEET-Benefits unsuccessful trajectory occurred. Finally, MLR was used to understand the typical individual characteristics of young people within this typology. It was found that young people at age 18/19 after attending FE and within specific SY and GM MSOAs that largely mirrored EST deprived areas were likely to become NEET and claim long-term OfW benefits rather than enter the labour market. The characteristics of individuals within the FE-NEET-Benefits typology were typically females, white or mixed ethnicity, required SEN, FSM or had low post-16 attainment.
With this additional insight, both CAs can better understand their local landscape, facilitate targeted data-driven interventions to prevent unsuccessful school-to-work trajectories and in turn drive regional economic growth. As the skills landscape and EST deprivation have remained consistent since the sample cohort, particularly in SY, there is a high likelihood of future school-leaver cohorts from the identified MSOAs to also experience difficult pathways into the labour market. To aid future cohorts, SYMCA and GMCA should focus on targeting regional education and skills development in problematic local areas when young people are age 18/19, alongside FE related interventions to help prevent NEET and reliance on OfW benefits such as through increasing HE participation or facilitating employment.
The novel regional sequence analysis method used in this study could be applied to other CAs in England or regions within different countries where place-based policymaking is required. In Europe such an approach could help uncover school-leaver geographic patterns within ‘left behind’ countries (Velthuis et al., 2024) and within the US could provide a unique perspective to inter-state school-to-work discrepancies (Chetty et al., 2018).
I thank the Office for National Statistics and the Department for Education for providing access to the Longitudinal Education Outcomes dataset. I thank the ONS Secure Research Service Customer Support, Operations and Statistical Support staff for their assistance and time to clear research outputs. Additionally, a thank you to the University of Sheffield Department of Economics for allowing me to use their resources.
I would also like to thank my PhD supervisors Andy Dickerson, Gwilym Pryce and Philip McCann for their valued support and guidance on the development of this paper. I also send my regards to Grace Simmons at the South Yorkshire Mayoral Combined Authority for our regular discussions. Moreover, I am grateful for the funding provided by the Economic and Social Research Council through the Data Analytics and Society Centre for Doctoral Training, as well as funding from my PhD project partner, the South Yorkshire Mayoral Combined Authority.
This work contains statistical data from ONS which is Crown Copyright. The work was undertaken in the Office for National Statistics Secure Research Service using data from ONS and other owners and does not imply the endorsement of the ONS or other data owners. The work uses research datasets which may not exactly reproduce National Statistics aggregates.
Shivani Sickotra, School of Education, Sheffield Methods Institute, University of Sheffield, UK. Email: ssickotra1@gmail.com
Anders, J., & Dorsett, R. (2017). What young English people do once they reach school-leaving age: A cross-cohort comparison for the last 30 years. Longitudinal and Life Course Studies, 8(1), 75-103. CrossRef link
Anderson, O., & Nelson, M. (2021). Post 16 education and labour market activities, pathways and outcomes (LEO). Department for Education.
Bailey, D., Pitelis, C. N., & Tomlinson, P. R. (2023). Place-based industrial and regional strategy – levelling the playing field. Regional Studies, 57(6), 977-983. CrossRef link
Battiston, A., Patrignani, P., Hedges, S., & Conlon, G. (2019). Labour market outcomes disaggregated by subject area using the Longitudinal Education Outcomes (LEO) data. Centre for Vocational Education Research.
Beatty, C., & Fothergill, S. (2020). Productivity in Sheffield City Region. CRESR, Sheffield Hallam University.
Boshoff, J., Moore, J., & Speckesser, S. (2019). Inequality in education and labour market participation of young people across English localities: An exploration based on Longitudinal Education Outcomes (LEO) data. Centre for Vocational Education Research.
Breach, A. (2019). Parks and Innovation: Lessons from Sheffield’s Advanced Manufacturing Park. Centre for Cities.
Chetty, R., & Hendren, N. (2018). The Impacts of Neighborhoods on Intergenerational Mobility I: Childhood Exposure Effects. The Quarterly Journal of Economics, 133(3), 1107-1162. CrossRef link
Chetty, R., Friedman, J. N., Hendren, N., Jones, M. R., & Porter, S. R. (2018). The Opportunity Atlas: Mapping the Childhood Roots of Social Mobility. National Bureau of Economic Research Working Papers, 25147. CrossRef link
Corradini, C., Morris, D., & Vanino, E. (2022). Towards a regional approach for skills policy. Regional Studies, 1-12. CrossRef link
Coyle, D., & Muhtar, A. (2023). Levelling up policies and the failure to learn. Journal of the Academy of Social Sciences, 18(3-4), 406-427. CrossRef link
De-Coulon, A., Hedges, S., Nafilyan, V., & Speckesser, S. (2017). Young people in low level vocational education: characteristics, trajectories and labour market outcomes. Centre for Vocational Educational Research. https://cver.lse.ac.uk/textonly/cver/pubs/cverdp004.pdf
DfE. (2019). LEO Data: a guide for users. Department for Education.
DfE. (2020). Post-16 pathways at level 3 and below: Experimental statistics on young people’s transitions from education to work in England. Department for Education.
DfE. (2023). Adult education devolution. GOV.UK.
DfE. (2024). Longitudinal Education Outcomes (LEO): collection. https://www.
gov.uk/government/collections/longitudinal-education-outcomes-leo-collection
DLUHC. (2022). Levelling Up the United Kingdom. Department for Levelling Up, Housing and Communities, Crown copyright.
DLUHC. (2015). DCLG Indices of Deprivation 2015: i. Income Deprivation Affecting Children Index (IDACI). https://opendatacommunities.org
Dickerson, A., & McIntosh, S. (2013). The Impact of Distance to Nearest Education Institution on the Post-compulsory Education Participation Decision. Urban Studies, 50(4), 742-758. CrossRef link
Dickerson, A., McDool, E., & Morris, D. (2023). Post-Compulsory Education Pathways and Labour Market Outcomes. Education Economics, 31(3), 326-352. CrossRef link
Dickinson, P., Rubio, J. C., Hogarth, T., & Warhurst, C. (2022). Labour Market Information Report: A report prepared for South Yorkshire Mayoral Combined Authority. University of Warwick.
Etherington, D., & Jones, M. (2016). Devolution and Disadvantage in the Sheffield City Region: An Assessment of Employment, Skills and Welfare Policies. University of Sheffield.
Forth, T. (2022). The economic strength of 1m+ population cities in the UK and the EU. https://twitter.com/thomasforth/status/1592033570289516545/photo/1
Fransham, M., Herbertson, M., Pop, M., Morais, M. B., & Lee, N. (2023). Level best? The levelling up agenda and UK regional inequality. Regional Studies. CrossRef link
Furlong, A., & Cartmel, F. (2007). Social change and labour market “transitions.” In A. Warde & N. Crossley (Eds.), Young People and Social Change: New Perspectives (2nd ed., Chapter 3). Open University Press.
Gabadinho, A., Ritschard, G., Müller, N. S., & Studer, M. (2011). Analyzing and visualizing state sequences in R with TraMineR. Journal of Statistical Software, 40(4), 1-37. CrossRef link
Galaster, G., & Sharkey, P. (2017). Spatial Foundations of Inequality: A Conceptual Model and Empirical Overview. RSF: The Russell Sage Foundation Journal of the Social Sciences, 3(2), 1-33. CrossRef link
GMESAP. (2022). Local Skills Report and Labour Market Plan. Greater Manchester Employment and Skills Advisory Panel.
GOV.UK. (2024). Get Information about Schools. London: GOV.UK.
GM CoC. (2023). Greater Manchester Local Skills Improvement Plan: A Skilla Plan for Everybody. Greater Manchester Chamber of Commerce.
GMCA. (2025). Together we are Greater Manchester. Greater Manchester Combined Authority.
GMCA. (2022). Greater Manchester Independent Prosperity Review: Evidence Update: Skills Utilisation and Employer Investment in Skills. Greater Manchester Combined Authority.
HM Government. (2025). Post-16 Education and Skills. HM Government.
KADA. (2023). South Yorkshire Skills and Employment Evidence Base. KADA Research.
Keep, E., & Mayhew, K. (2010). Moving beyond skills as a social and economic panacea. British Sociological Association, 24(3), 565-577. CrossRef link
Liao, T. F., Bolano, D., Brzinsky-Fay, C., Cornwell, B., Fasang, A. E., Helske, S., Piccarreta, R., Raab, M., Ritschard, G., Struffolino, E., & Studer, M. (2022). Sequence analysis: Its past, present, and future. Social Science Research, 107, 102772. CrossRef link
Lorentzen, T., Bäckman, O., Ilmakunnas, I., & Kauppinen, T. (2019). Pathways to Adulthood: Sequences in the School to Work Transition in Finland, Norway and Sweden. Social Indicators Research, 141(3), 1285-1305. CrossRef link
Lupton, R., Thomson, S., Velthuis, S., & Unwin, L. (2021). Moving on from initial GCSE ‘failure’: Post-16 transitions for ‘lower attainers’ and why the English education system must do better. Nuffield Foundation.
Martin, R. (1988). The Political Economy of Britain’s North-South Divide. Transactions of the Institute of British Geographers, 13(4), 389-418. CrossRef link
Martin, R., Gardiner, B., Pike, A., Sunley, P., & Tyler, P. (2021). Levelling Up Left Behind Places: The Scale and Nature of the Economic and Policy Challenge (1st ed.). Regional Studies Association, Taylor and Francis.
Martin, R., Pike, A., Sunley, P., Tyler, P., & Gardiner, B. (2022). ‘Levelling up’ the UK: reinforcing the policy agenda. Regional Studies, Regional Science, 9(1), 794-817. CrossRef link
McCann, P. (2023). IFS Deaton Review of Inequalities: Levelling-up economics. Institute for Fiscal Studies.
McCann, P., Ortega-Argilés, R., Sevinc, D., & Cepeda-Zorrilla, M. (2023). Rebalancing UK regional and industrial policy post-Brexit and post-Covid-19: lessons learned and priorities for the future. Regional Studies, 1-13. CrossRef link
Newman, J., Collinson, S., Driffield, N., Gilbert, N., & Hoole, C. (2023). Mechanisms of metagovernance as structural challenges to levelling up in England. Regional Studies. CrossRef link
OECD. (2023). Regions in Industrial Transition 2023: New Approaches to Persistent Problems, OECD Regional Development Studies (1st ed.). OECD Publishing. CrossRef link
ONS. (2023). LEO I2SE Variable Request Form V2.1. Office for National Statistics.
Patias, N., Rowe, F., & Arribas-Bel, D. (2021). Trajectories of neighbourhood inequality in Britain: Unpacking inter-regional socioeconomic imbalances, 1971-2011. The Geographical Journal, 188(2), 150-165. CrossRef link
Paun, A., Nice, A., & Rycroft, L. (2022). How metro mayors can help level up England. Institute for Government.
Pope, T., Shearer, E., & Hourston, P. (2022). Levelling up and skills policy: How qualifications and training can help boost regional productivity. Institute for Government.
Ravetz, J. (2000). City Region 2020: Integrated Planning for a Sustainable Environment (1st ed.). Earthscan Publications Ltd.
Saket, J. S., & Pandya, S. (2016). An Overview of Partitioning Algorithms in Clustering Techniques. International Journal of Advanced Research in Computer Engineering and Technology, 5(6), 2278-1323.
Sandford, M. (2023). Devolution to Local Government in England. House of Commons Library.
Shirt, J. (2021). The Steel City Stained by Division: A Mixed-Methods Approach to Socio-Economic Inequalities in Sheffield. University of Groningen.
Sickotra, S. (2022). Advancing Economic Development in South Yorkshire through Understanding Education Trajectories: A Longitudinal Data Analytics Approach. University of Sheffield.
Sickotra, S. (2024). South Yorkshire and Greater Manchester School-to-work Sequence Analysis using Longitudinal Education Outcomes Data. Retrieved from GitHub: https://github.com/sickotra/SY_GM_SchooltoWork_Sequence_Analysis_using_LEO
Sickotra, S. (2025). Data Resource Profile: A Guide for Constructing School-to-work Sequence Analysis Trajectories Using the Longitudinal Education Outcomes (LEO) Data. International Journal of Population Data Science. CrossRef link
SYMCA. (2022). Our Strategic Economic Plan 2021-2041. South Yorkshire Mayoral Combined Authority.
SYMCA. (2024). South Yorkshire’s Skills Strategy. South Yorkshire Mayoral Combined Authority.
Taylor, I., Evans, K., & Fraser, P. (1996). A Tale of Two Cities: A Study in Manchester and Sheffield (1st ed.). Routledge.
Thomas, B., Pritchard, J., Ballas, D., Vickers, D., & Dorling, D. (2009). A Tale of Two Cities: The Sheffield Project. University of Sheffield.
Velthuis, S., Lupton, R., Thomson, S., & Unwin, L. (2019). The Contrasting Characteristics and Destinations of GCSE Lower Attainers in English Core City Regions. University of Manchester.
Velthuis, S., Royer, J., Le Petit-Guerin, M., Cauchi-Duval, N., Franklin, R., Leibert, T., MacKinnon, D., & Pike, A. (2024). Regional varieties of ‘left-behindness’ in the EU15. Regional Studies, 59(1), pp. 1-16. CrossRef Link
Wrigley, L. (2017). From ‘NEET’ to ‘Unknown’: Who is responsible for young people not in education, employment or training? Youth and Policy. https://www.youthandpolicy.org/articles/from-neet-to-unknown/
Appendix
Combined Authorities
Figure A1: Map of Combined Authorities in England (2021)
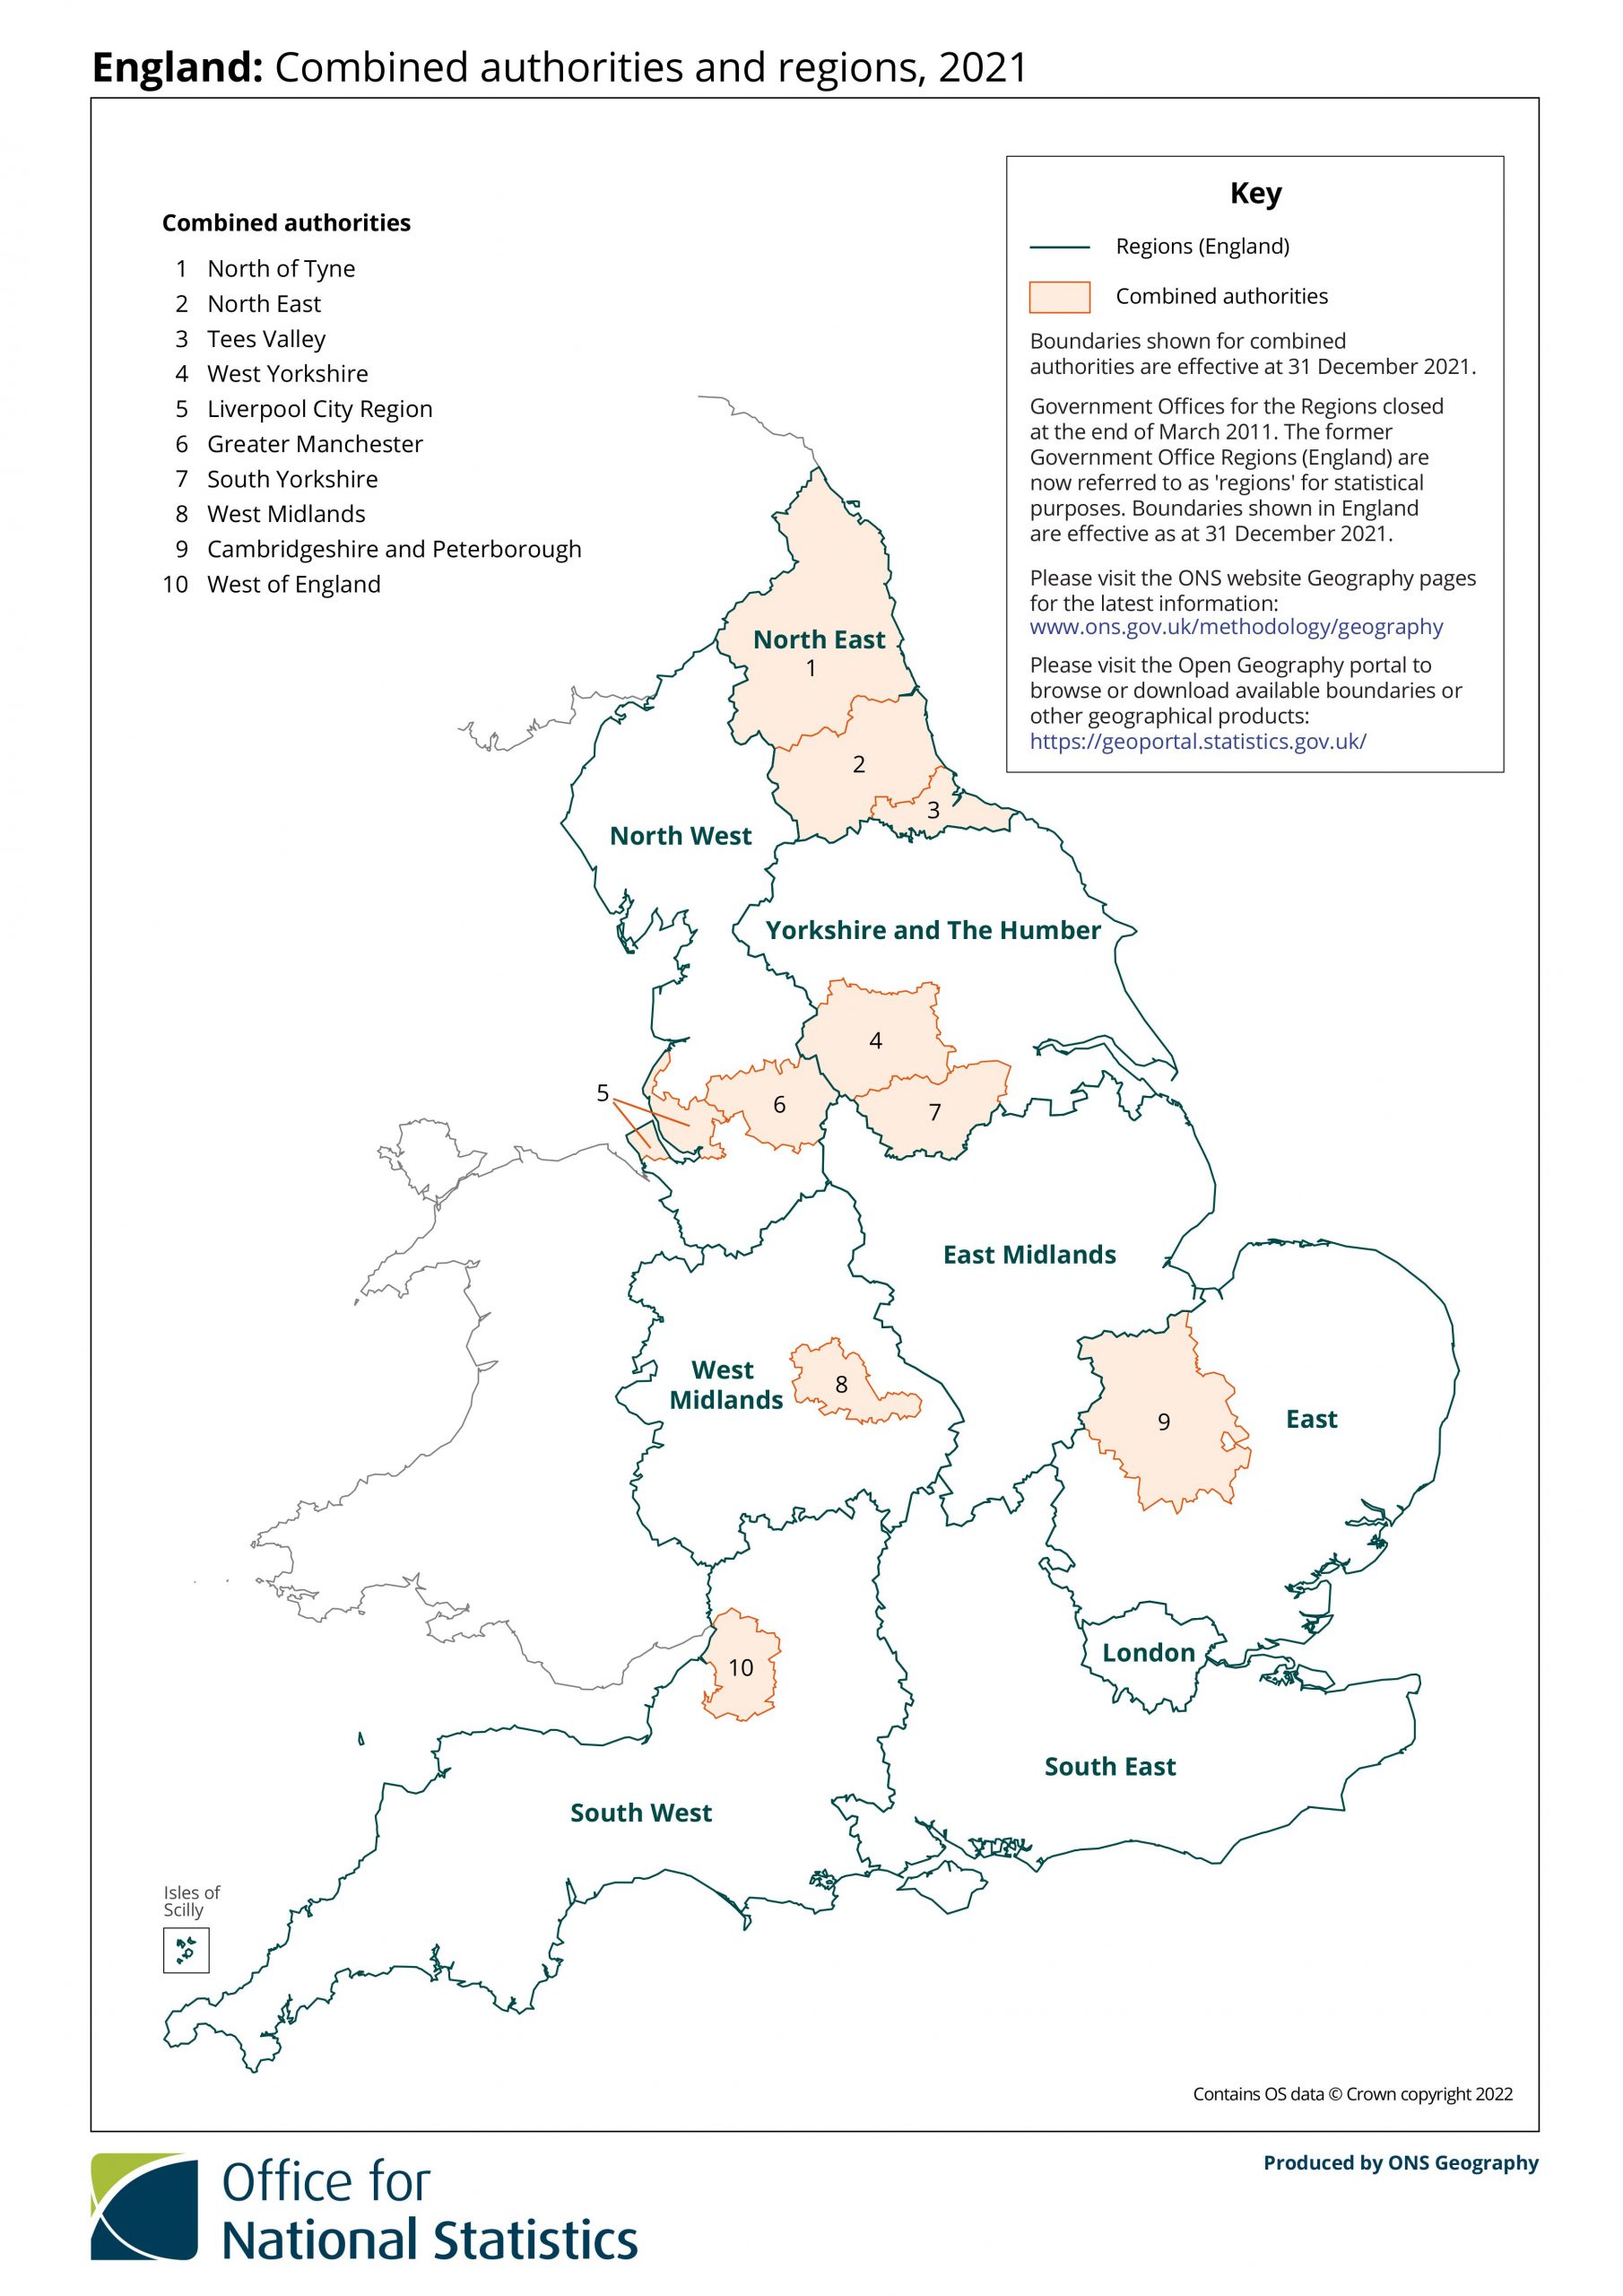
Source: (Office for National Statistics, 2022)
Table A1: Combined Authority Statistics
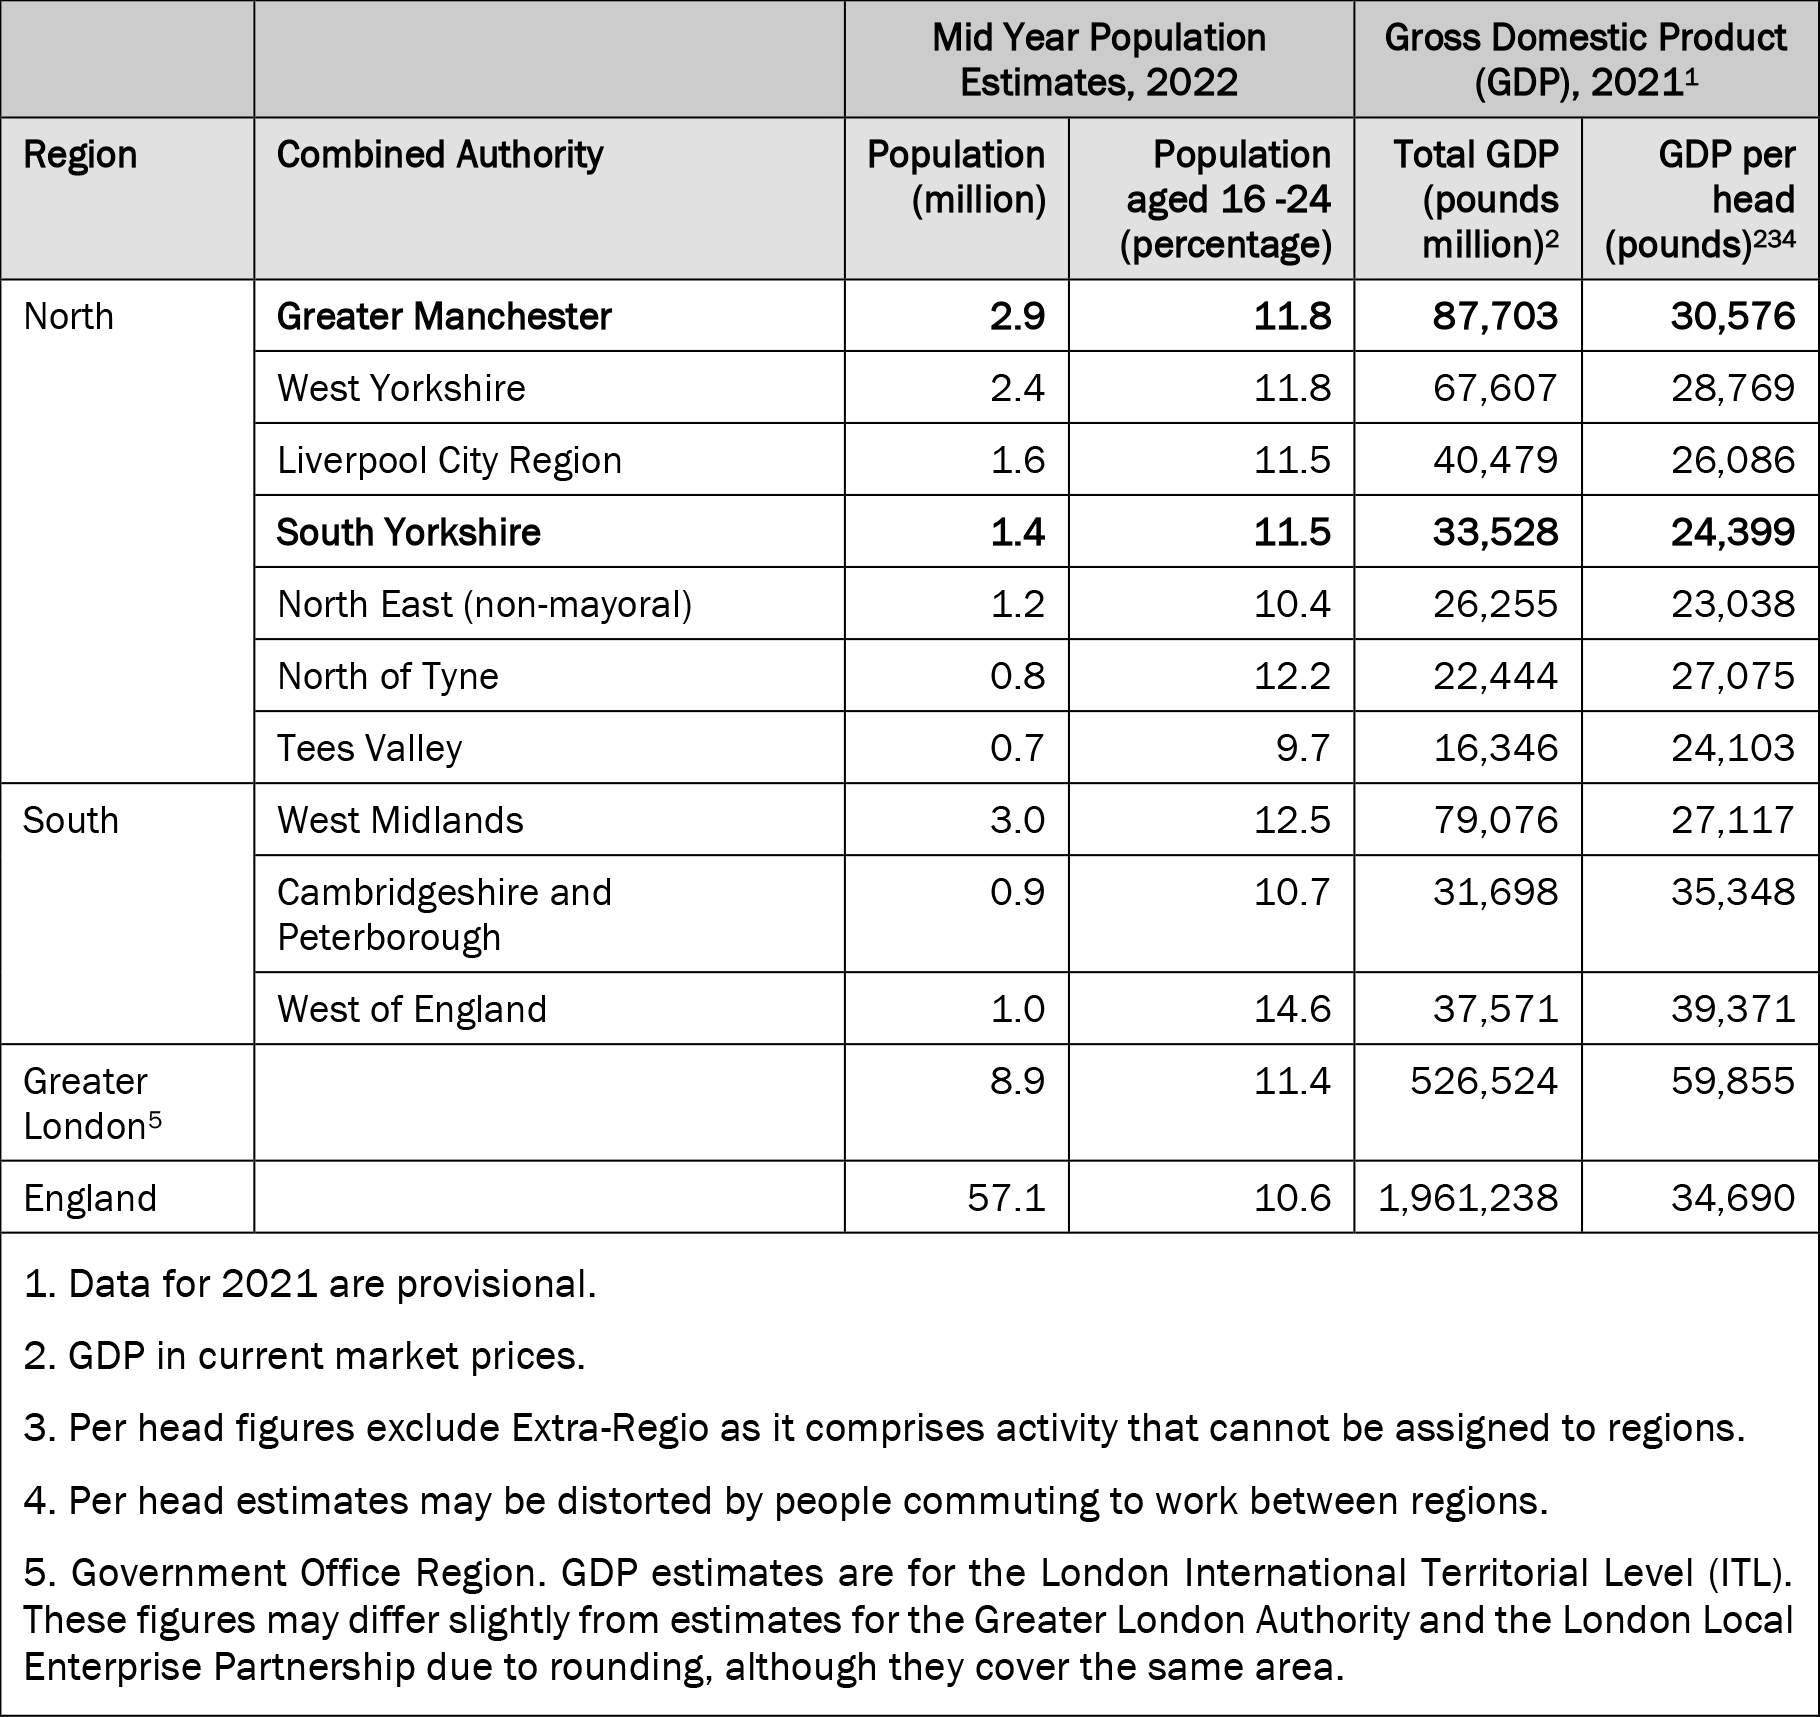
Source: (Office for National Statistics, 2023; Office for National Statistics, 2024).
Data Preprocessing
The school-to-work data were prepared in a yearly format for consistency and compatibility with the TraMineR R package (Gabadinho et al., 2011) used to conduct sequence analysis. The FE and NEET data in LEO were supplied in a yearly format, but more than one activity may have been recorded per academic year. In this case, the modal activity within the academic year was used and where there were multiple or no categorical modes, the first observed activity was used. The HE, employment and benefits data were prepared to match the yearly format, where any time spent within a state assumed the respective activity for the full year. Although this introduced some inaccuracy, the order in which the activity states were integrated helped to correct some of the states. All education and NEET states took precedence over any other state type, then any period of OfW benefits took priority over employment states. This hierarchy meant that young people who may have been employed yet claimed benefits at any time during the year had their yearly state recorded as OfW benefits. Since the focus of the research is placed on young people experiencing difficult trajectories into the labour market, the states hierarchy aligned with my intended purpose and was sufficient for this analysis.
As SYMCA was formed after 2011, CA boundaries correct in October 2023 were used. The requirement to use ‘future’ CA administrative boundaries can be seen as a strength to produce new insights relevant to current socio-economic policy and extend the regional skills literature regarding English education trajectories. The full procedure to prepare the research-specific data can be found in Author (Year).
Method
Sequence objects for the pooled SY and GM activity histories were created, with missingness as its own state. Sequence objects are an ordered collection of education and employment states per individual.
Table A2: Sequence Analysis Alphabet of Possible Activity States
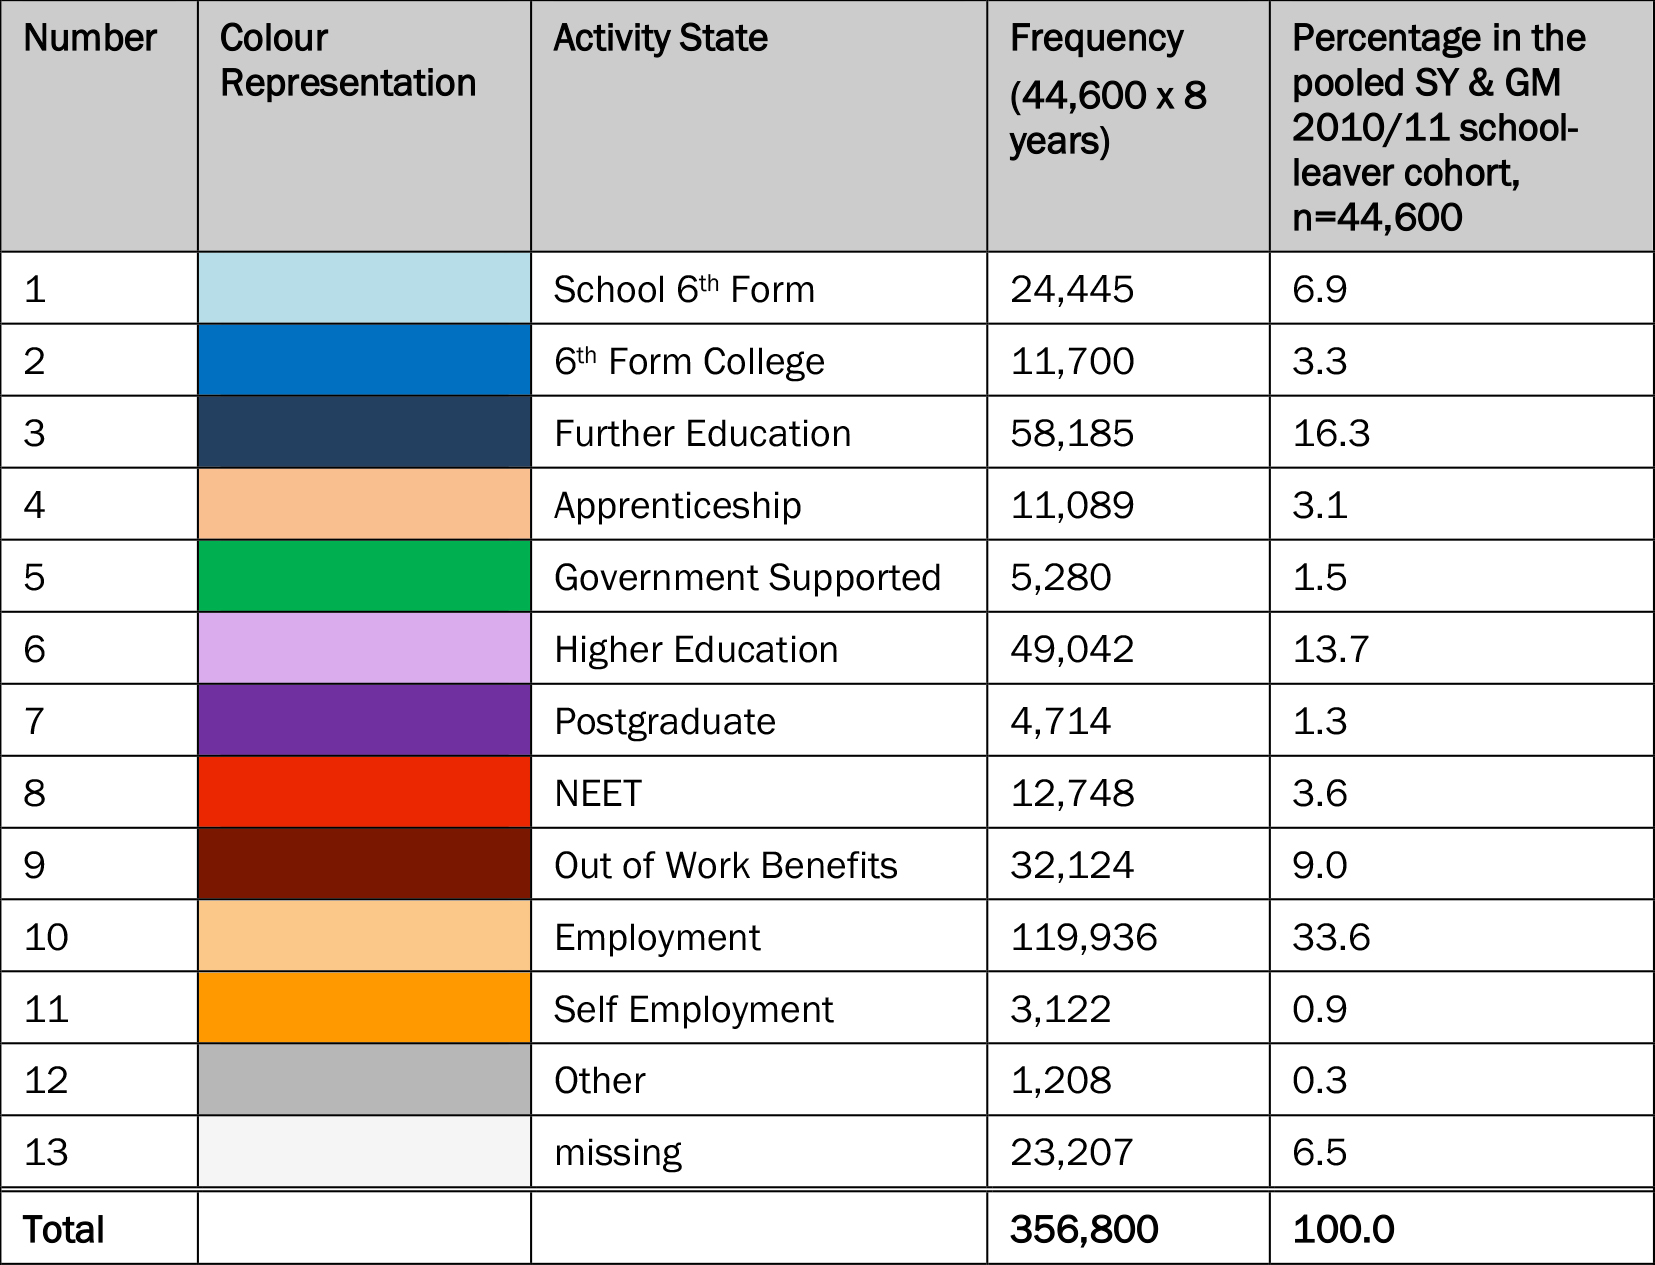
Table A2 presents the 13 possible activity states within the sequence objects, known as the sequence analysis alphabet, plus their distribution in the pooled cohort. The alphabet used was more comprehensive than those used in existing literature which typically include 4-6 states or refer to education levels without differentiating between the post-16 establishment types (DfE, 2020; Dickerson et al., 2023; Anders & Dorsett, 2017; De-Coulon et al., 2017). Although education levels can be insightful, potential patterns related to the establishment type risk being overlooked (Lupton et al., 2021). The Other category included activities such as part-time education, gap year students and working not for reward. Full details outlining the process to select this alphabet are available in Author (Year).
To perform sequence analysis, the likeness between sequences must be quantified using a dissimilarity measure. The Optimal Matching (OM) method was used to calculate the pairwise sequence dissimilarities and create a dissimilarity matrix. This method was selected as it has been the most widely used in sequence analysis (Liao et al., 2022). Within the sequence analysis workflow, researchers must make several ad-hoc decisions, such as the choice of dissimilarity measure, clustering algorithm, and the number of clusters. Another potential decision is the ‘indel’ and ‘substitution’ values within OM, which are relative parameters used to calculate the ‘distance’ between sequences and enable the creation of the dissimilarity matrix (Raab & Struffolino, 2022). The indel costs represent the ‘penalty’ for inserting or deleting a state to align one sequence with another, while substitution costs quantify the penalty for changing one state into another. For example, transforming the simple sequence ‘School-Employment’ into ‘School-Unemployment’ would involve a substitution cost, whereas aligning ‘School-Employment-Employment’ with ‘School-Employment’ would involve an indel cost to account for the missing state.
In this analysis, I chose to use the standard and constant indel costs of 1 and substitution costs of 2 (Gabadinho et al., 2011). This decision was based on both methodological and substantive considerations. Methodologically, these constant costs are the ‘default’ relative values used in sequence analysis, offering a simple and accepted baseline. They assume that all states in the sequence are equally important, but weight substitutions greater than indels by one unit. Substantively, school-to-work trajectories involve a variety of states each with distinct meanings but no clear hierarchy or universally agreed-upon importance. By treating all states equally, constant costs avoid the risk of overemphasising certain states based on subjective judgments or context-specific assumptions that might be introduced by more complex data-driven cost matrices. Whilst it is possible to use advanced cost specifications to capture differences between states, it is advised to adhere to the statistical assumption that all states are equally different and to only use non-constant costs when justified, such as when states have a clear ordinal structure (Studer et al., 2024). Moreover, Biemann & Datta (2014) suggested that OM outcomes are generally robust to variations in cost parameters, reducing the necessity for overly complex specifications. For these reasons, I chose to use standard constant OM costs in this analysis.
Table A2: Sequence Analysis Alphabet of Possible Activity States
TABLE A2 here
Table A2 presents the 13 possible activity states within the sequence objects, known as the sequence analysis alphabet, plus their distribution in the pooled cohort. The alphabet used was more comprehensive than those used in existing literature which typically include 4-6 states or refer to education levels without differentiating between the post-16 establishment types (DfE, 2020; Dickerson et al., 2023; Anders & Dorsett, 2017; De-Coulon et al., 2017). Although education levels can be insightful, potential patterns related to the establishment type risk being overlooked (Lupton et al., 2021). The Other category included activities such as part-time education, gap year students and working not for reward. Full details outlining the process to select this alphabet are available in Author (Year).
To perform sequence analysis, the likeness between sequences must be quantified using a dissimilarity measure. The Optimal Matching (OM) method was used to calculate the pairwise sequence dissimilarities and create a dissimilarity matrix. This method was selected as it has been the most widely used in sequence analysis (Liao et al., 2022). Within the sequence analysis workflow, researchers must make several ad-hoc decisions, such as the choice of dissimilarity measure, clustering algorithm, and the number of clusters. Another potential decision is the ‘indel’ and ‘substitution’ values within OM, which are relative parameters used to calculate the ‘distance’ between sequences and enable the creation of the dissimilarity matrix (Raab & Struffolino, 2022). The indel costs represent the ‘penalty’ for inserting or deleting a state to align one sequence with another, while substitution costs quantify the penalty for changing one state into another. For example, transforming the simple sequence ‘School-Employment’ into ‘School-Unemployment’ would involve a substitution cost, whereas aligning ‘School-Employment-Employment’ with ‘School-Employment’ would involve an indel cost to account for the missing state.
In this analysis, I chose to use the standard and constant indel costs of 1 and substitution costs of 2 (Gabadinho et al., 2011). This decision was based on both methodological and substantive considerations. Methodologically, these constant costs are the ‘default’ relative values used in sequence analysis, offering a simple and accepted baseline. They assume that all states in the sequence are equally important, but weight substitutions greater than indels by one unit. Substantively, school-to-work trajectories involve a variety of states each with distinct meanings but no clear hierarchy or universally agreed-upon importance. By treating all states equally, constant costs avoid the risk of overemphasising certain states based on subjective judgments or context-specific assumptions that might be introduced by more complex data-driven cost matrices. Whilst it is possible to use advanced cost specifications to capture differences between states, it is advised to adhere to the statistical assumption that all states are equally different and to only use non-constant costs when justified, such as when states have a clear ordinal structure (Studer et al., 2024). Moreover, Biemann & Datta (2014) suggested that OM outcomes are generally robust to variations in cost parameters, reducing the necessity for overly complex specifications. For these reasons, I chose to use standard constant OM costs in this analysis.
Figure A2: Observed Activities Data in the Pooled South Yorkshire and Greater Manchester 2010/11 School-leaver Cohort, n = 44,600
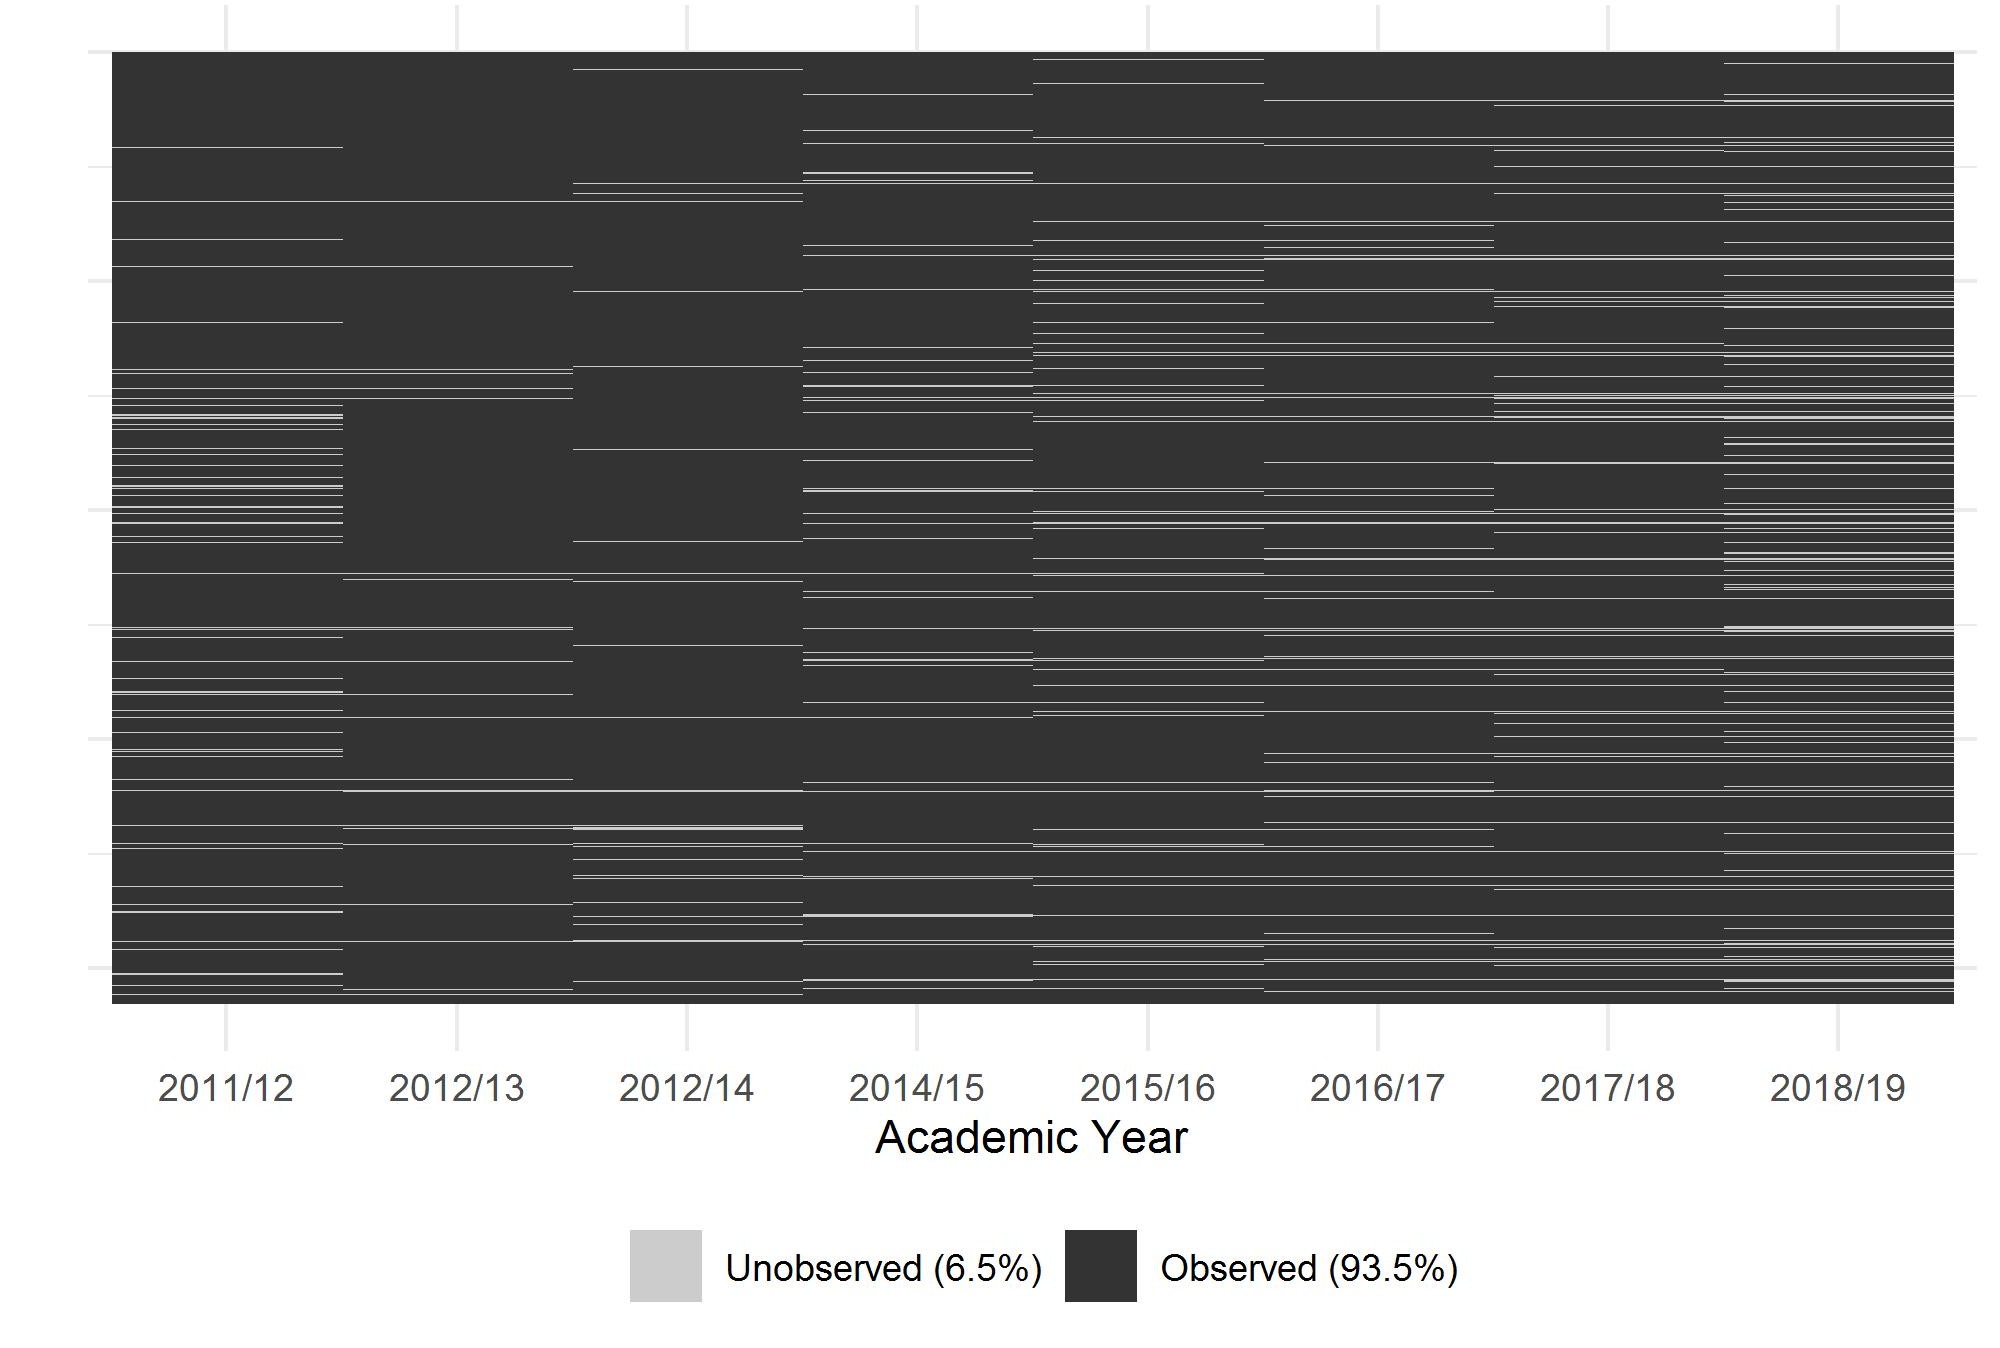
Note: Some overplotting may be present.
Since LEO data is administrative, there were only 6.5% unobserved activities in the pooled SY and GM cohort, shown in Figure A2, hence it was not required to impute missing activities data which is commonly necessary when using sequence methods (Liao et al., 2022).
Sequence and Cluster Analysis
Figure A3: Sequence Index Plot Showing School-to-work Trajectories for Pooled South Yorkshire and Greater Manchester 2010/11 School-leaver Cohort (n = 44,600), Ordered by OM Distances
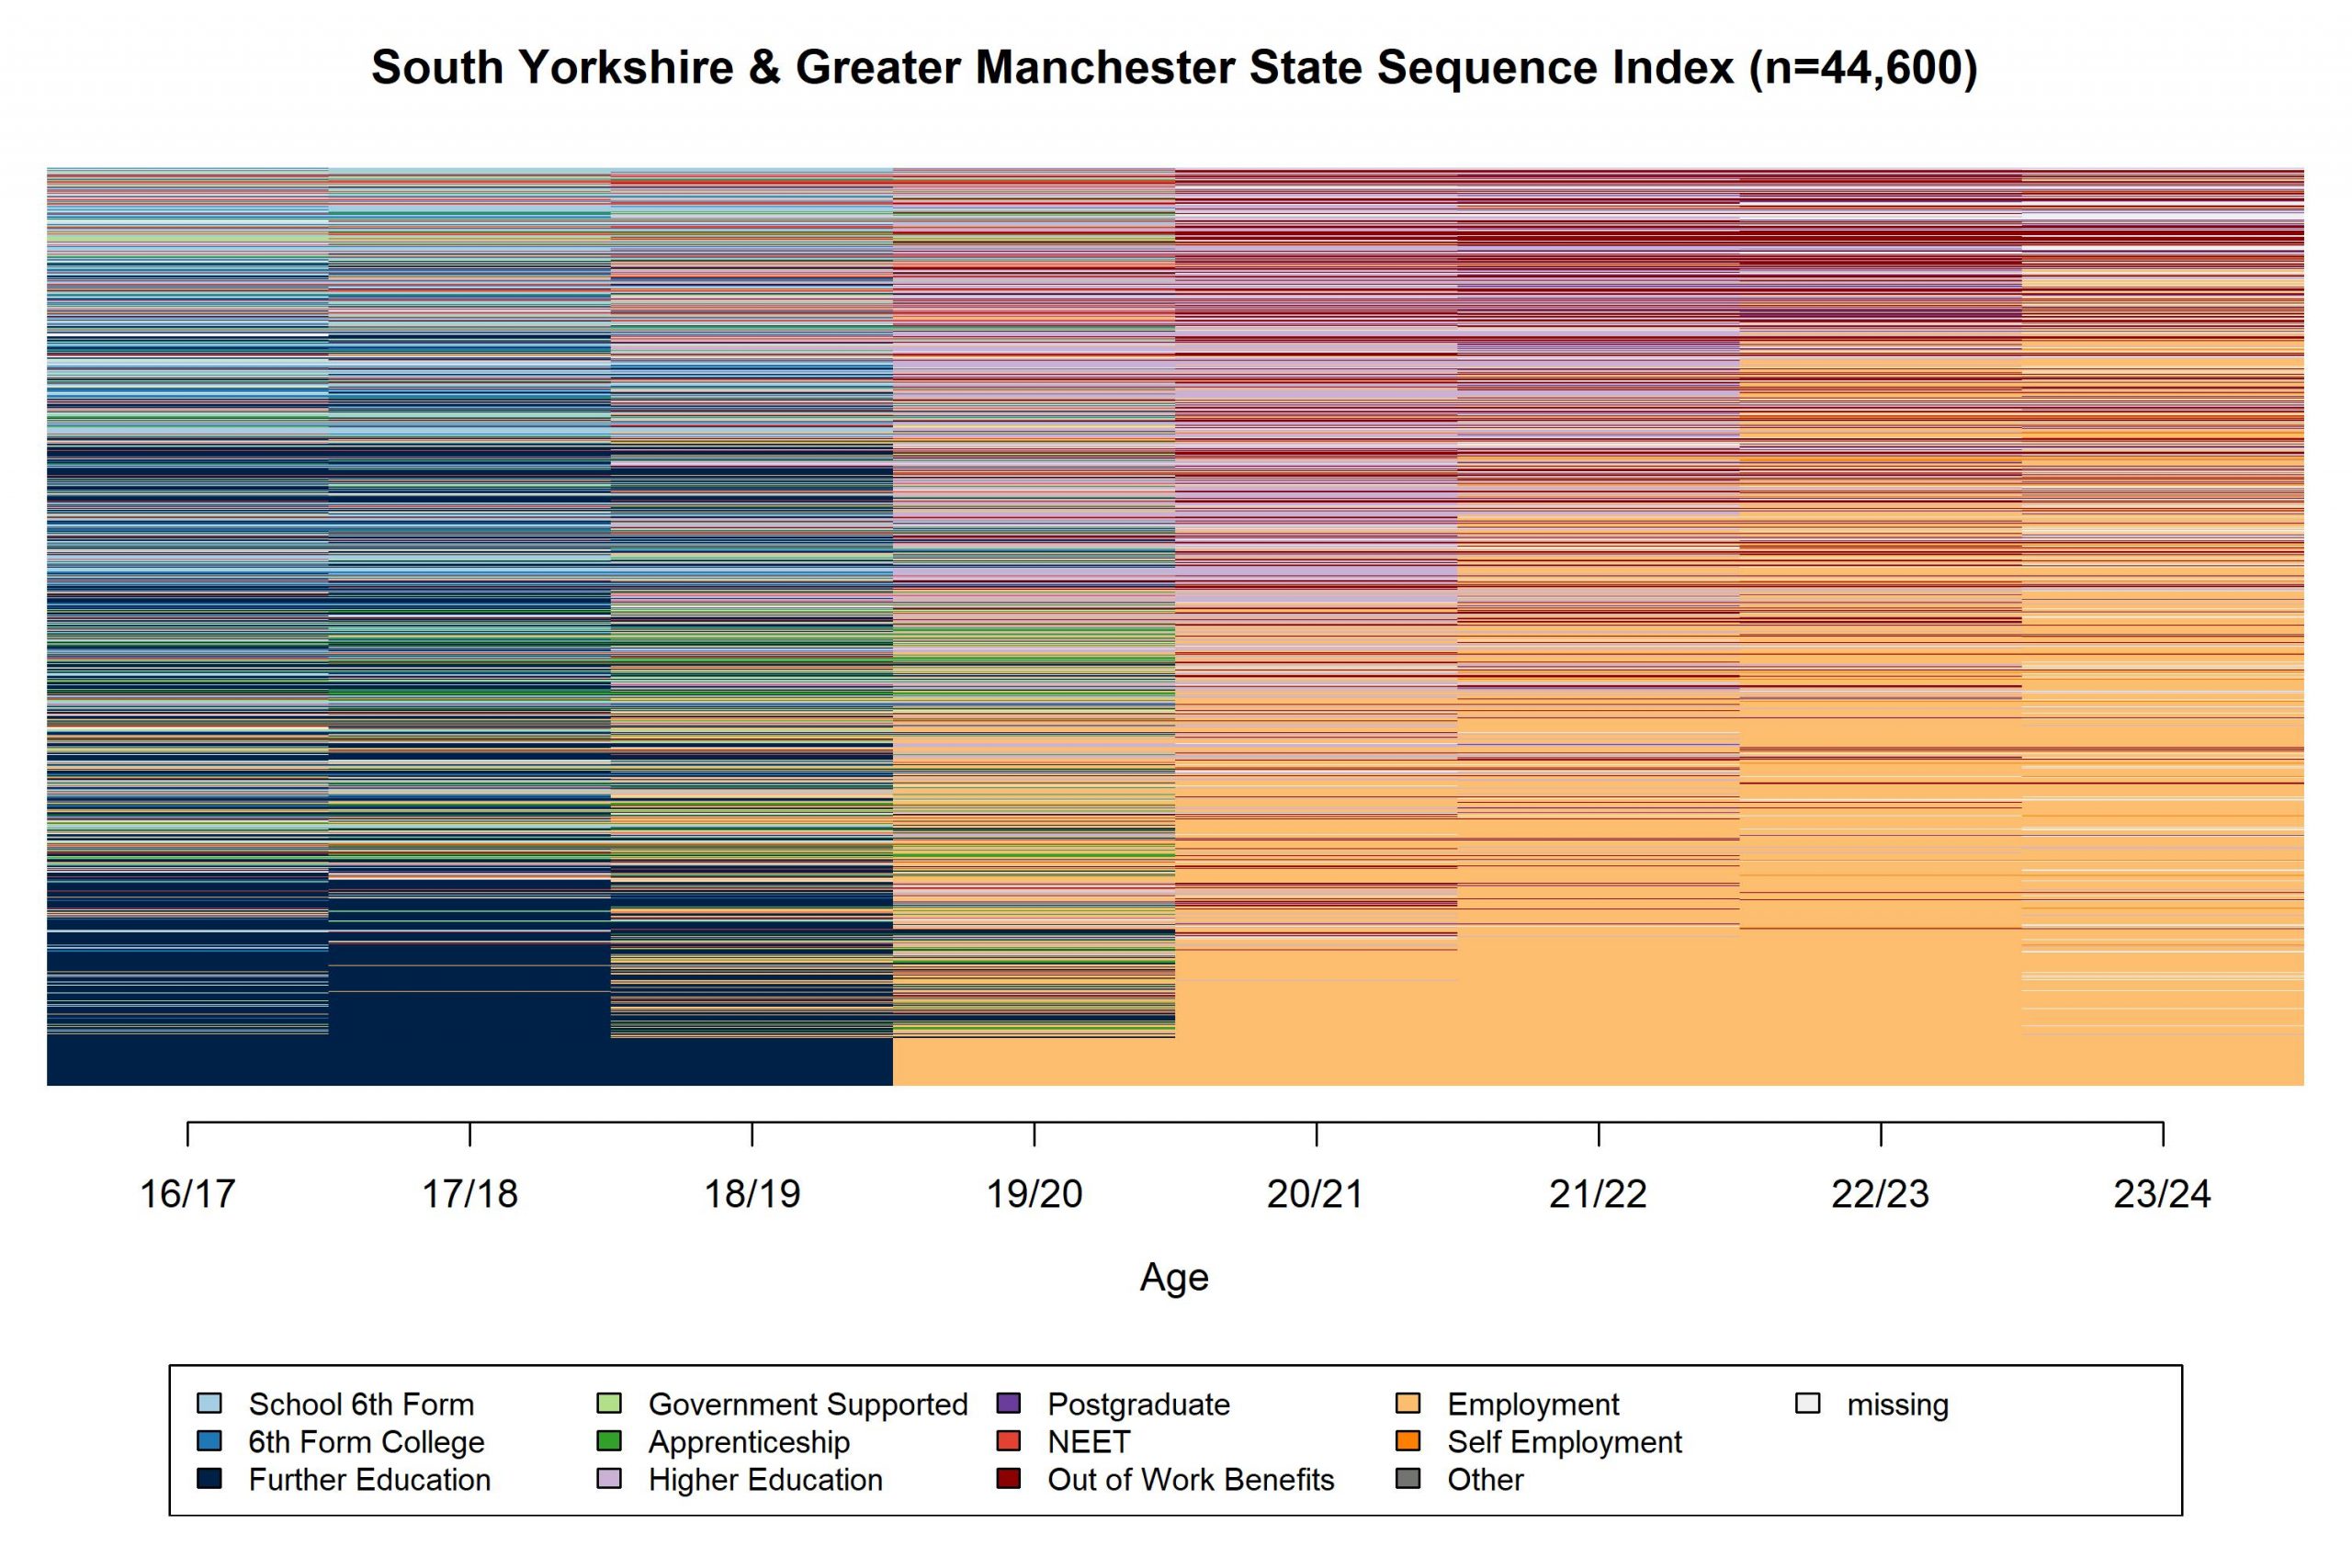
Note: Some overplotting may be present.
Figure A4: Sequence Index Plots Showing School-to-work Trajectories for the Pooled 2010/11 School-leavers (n = 44,600), split by Combined Authority and Ordered by OM Distances
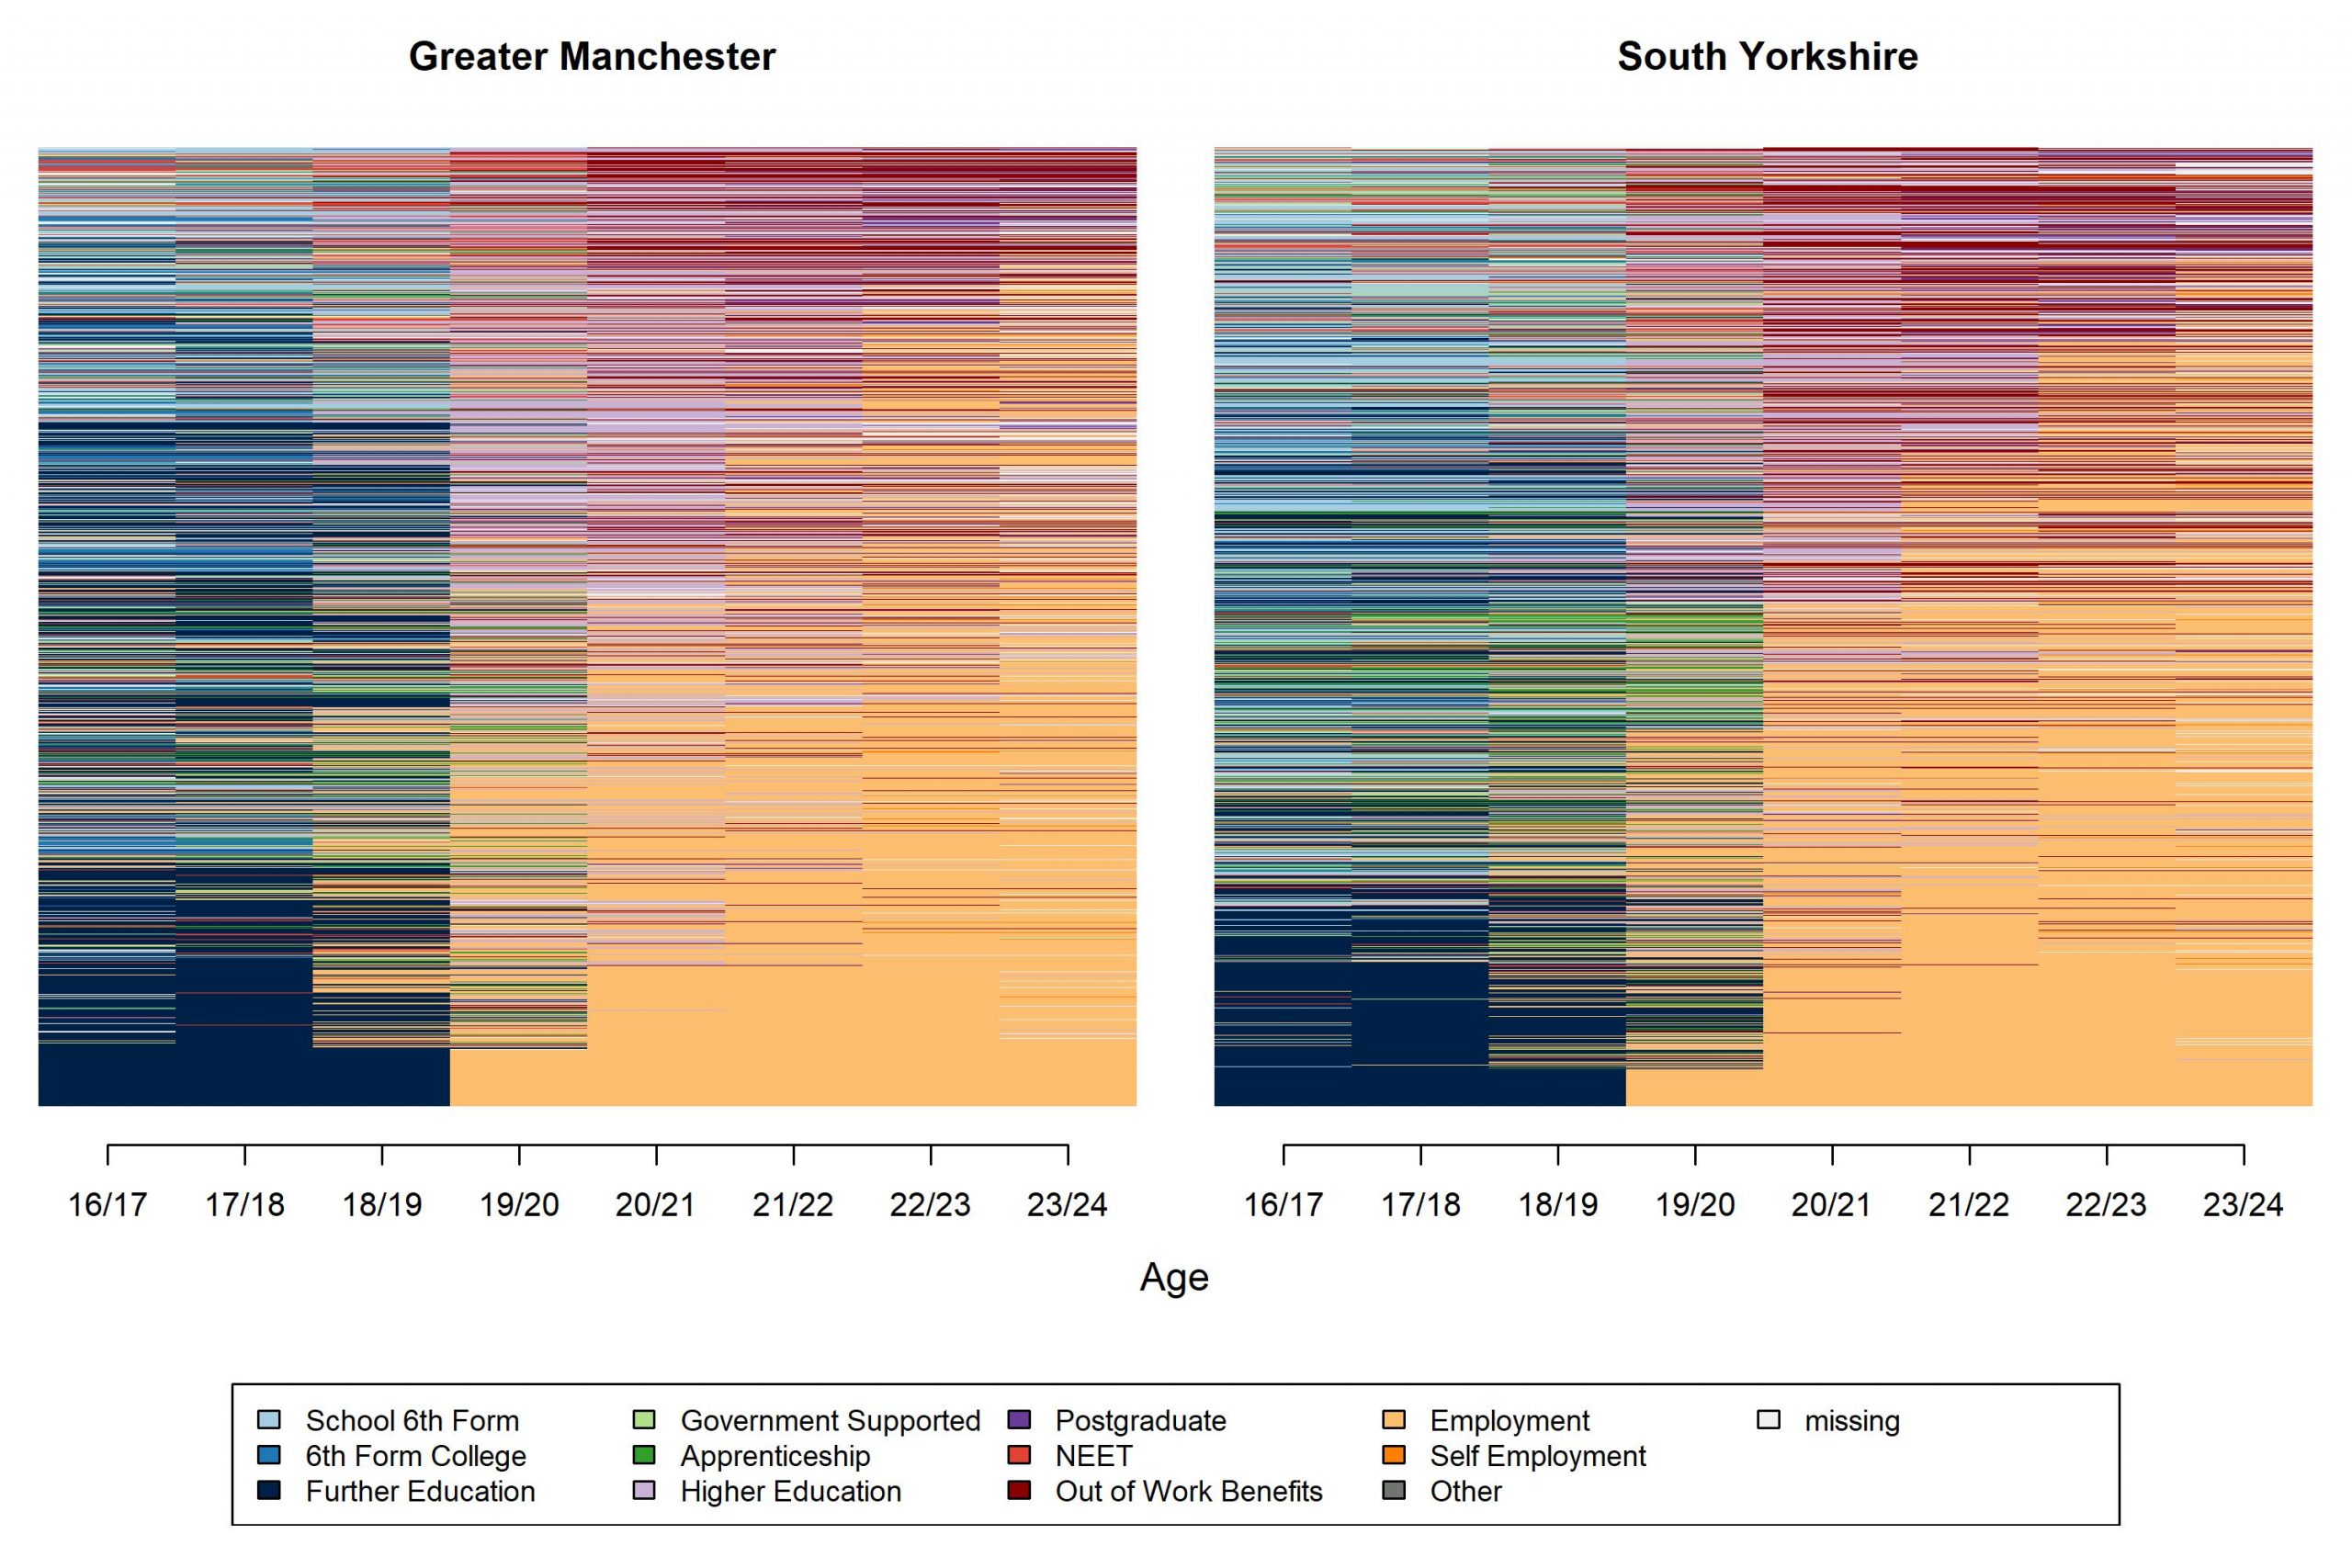
Note: Some overplotting may be present.
Figure A5: Activity State Distribution Plot Showing School-to-work Trajectories for Pooled South Yorkshire and Greater Manchester 2010/11 School-leaver Cohort (n = 44,600)
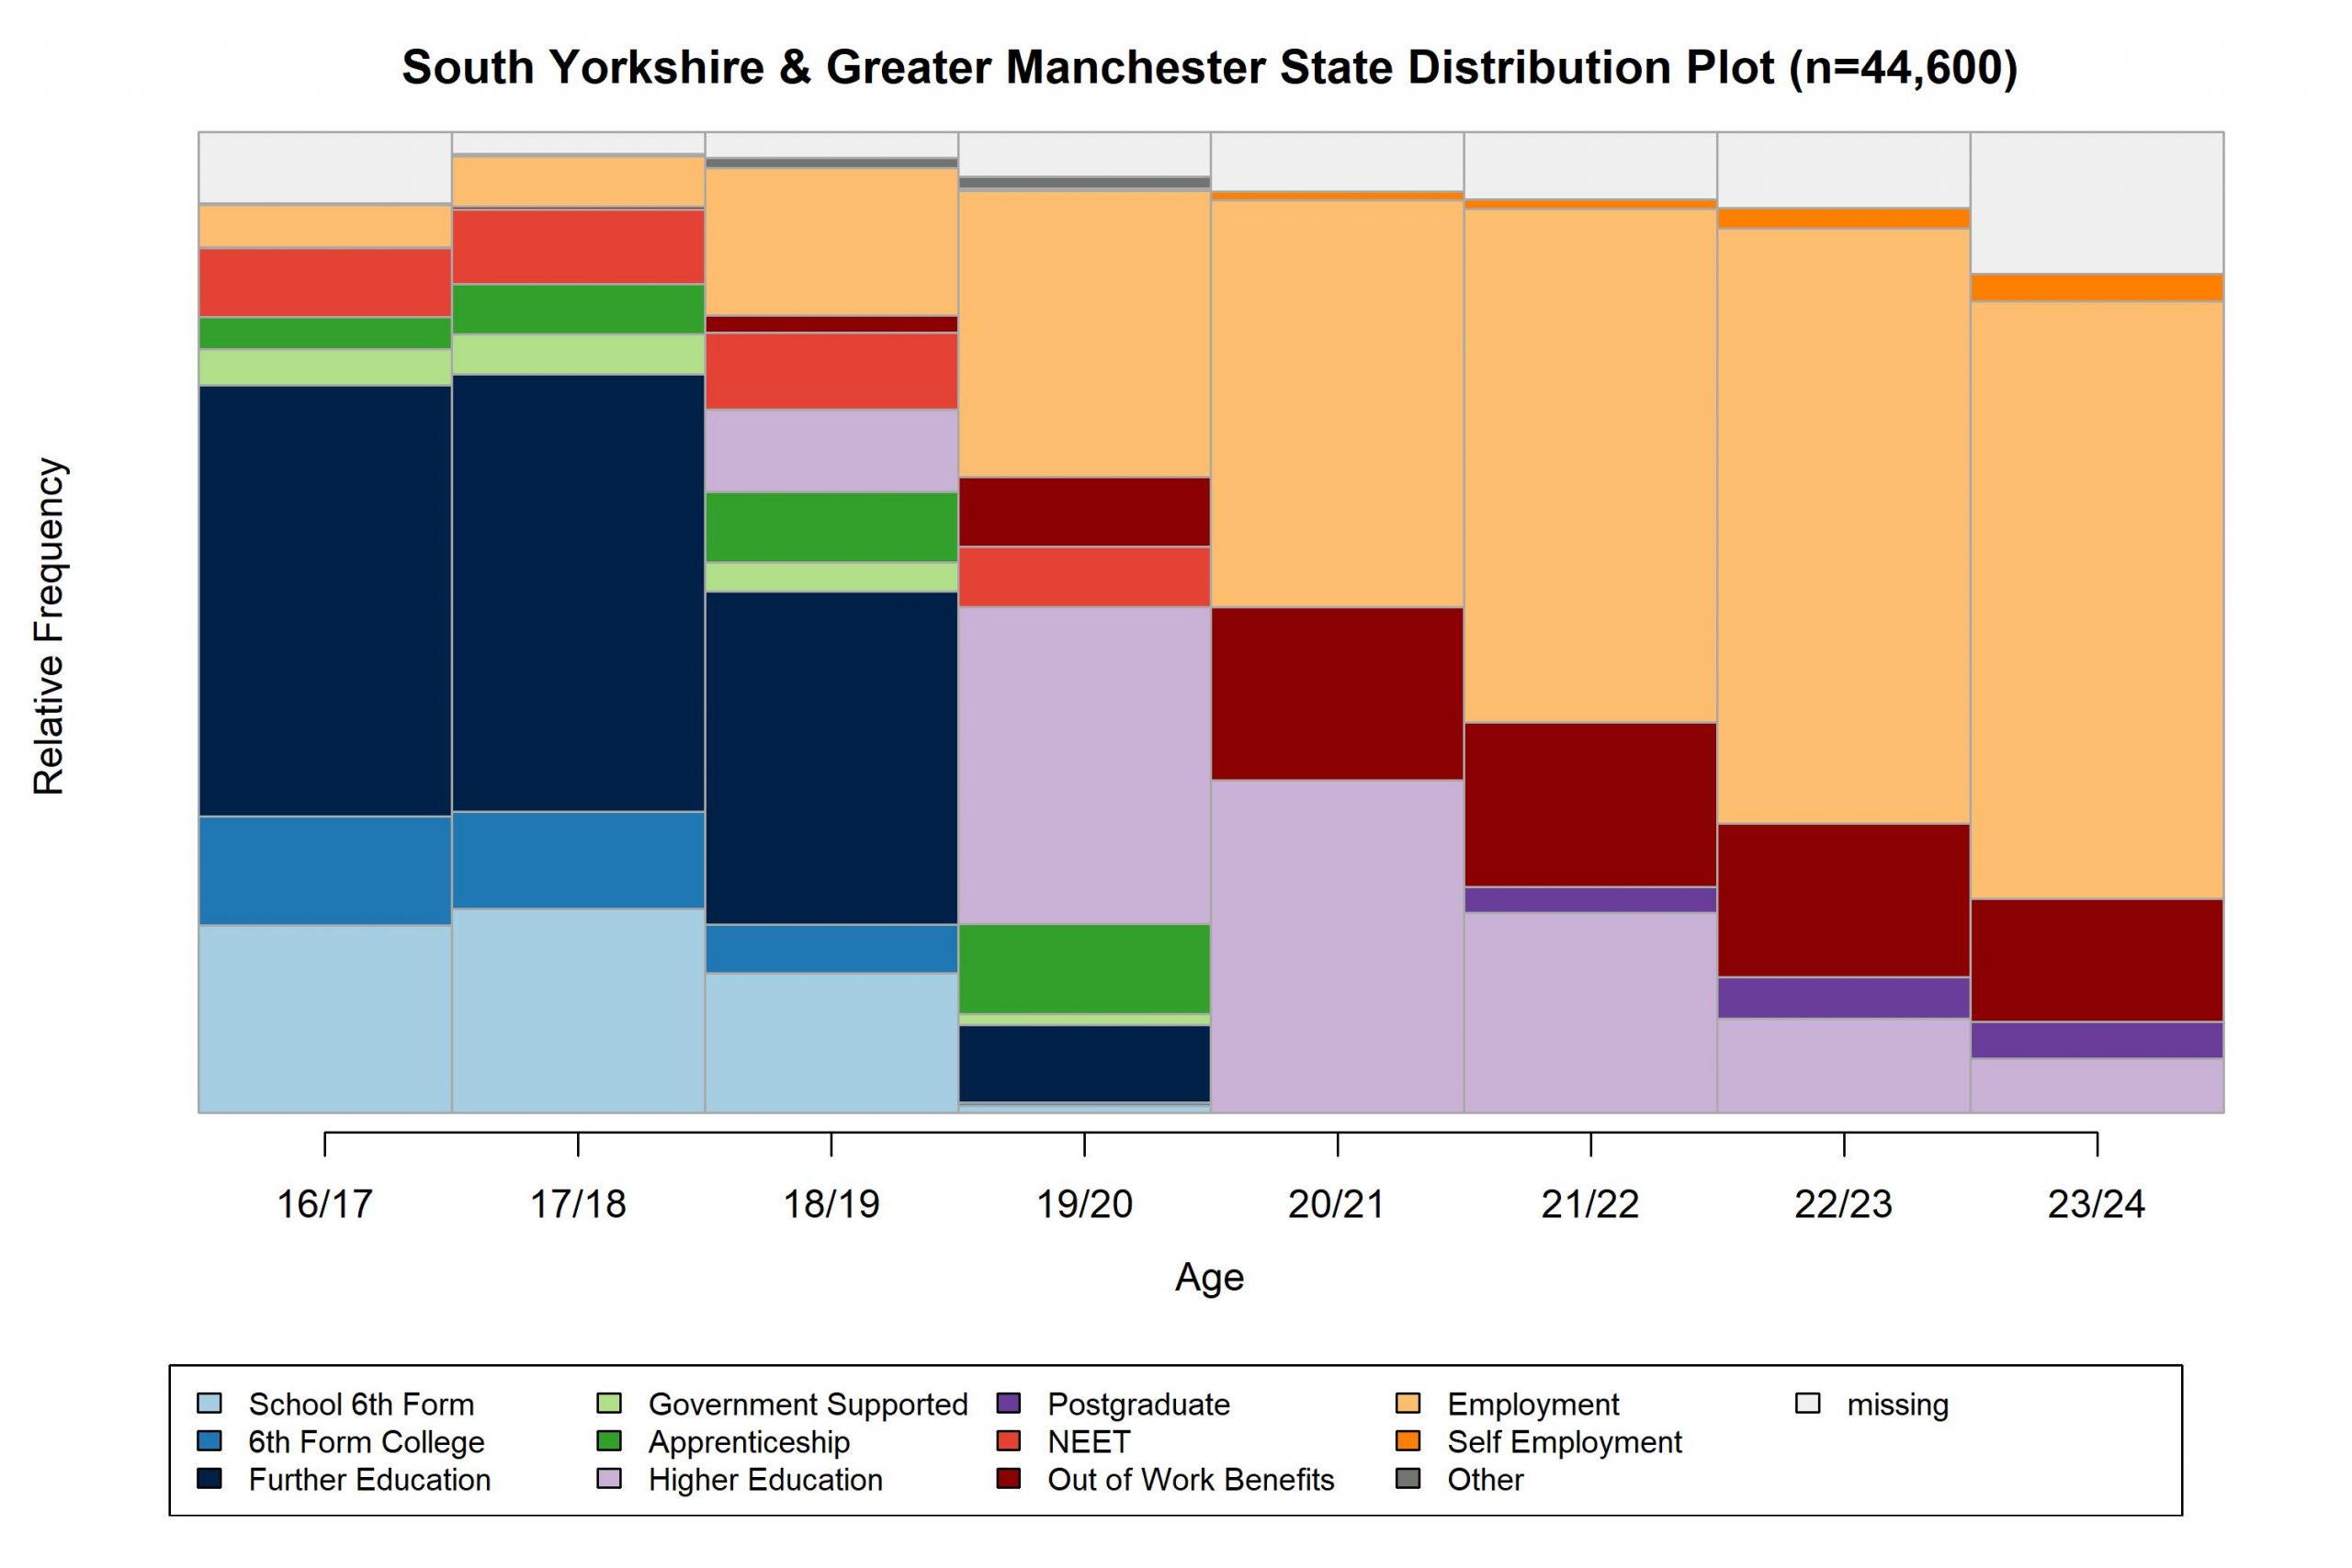
Figure A6: Activity State Distribution Plots Showing School-to-work Trajectories for the Pooled 2010/11 School-leavers (n = 44,600), split by Combined Authority
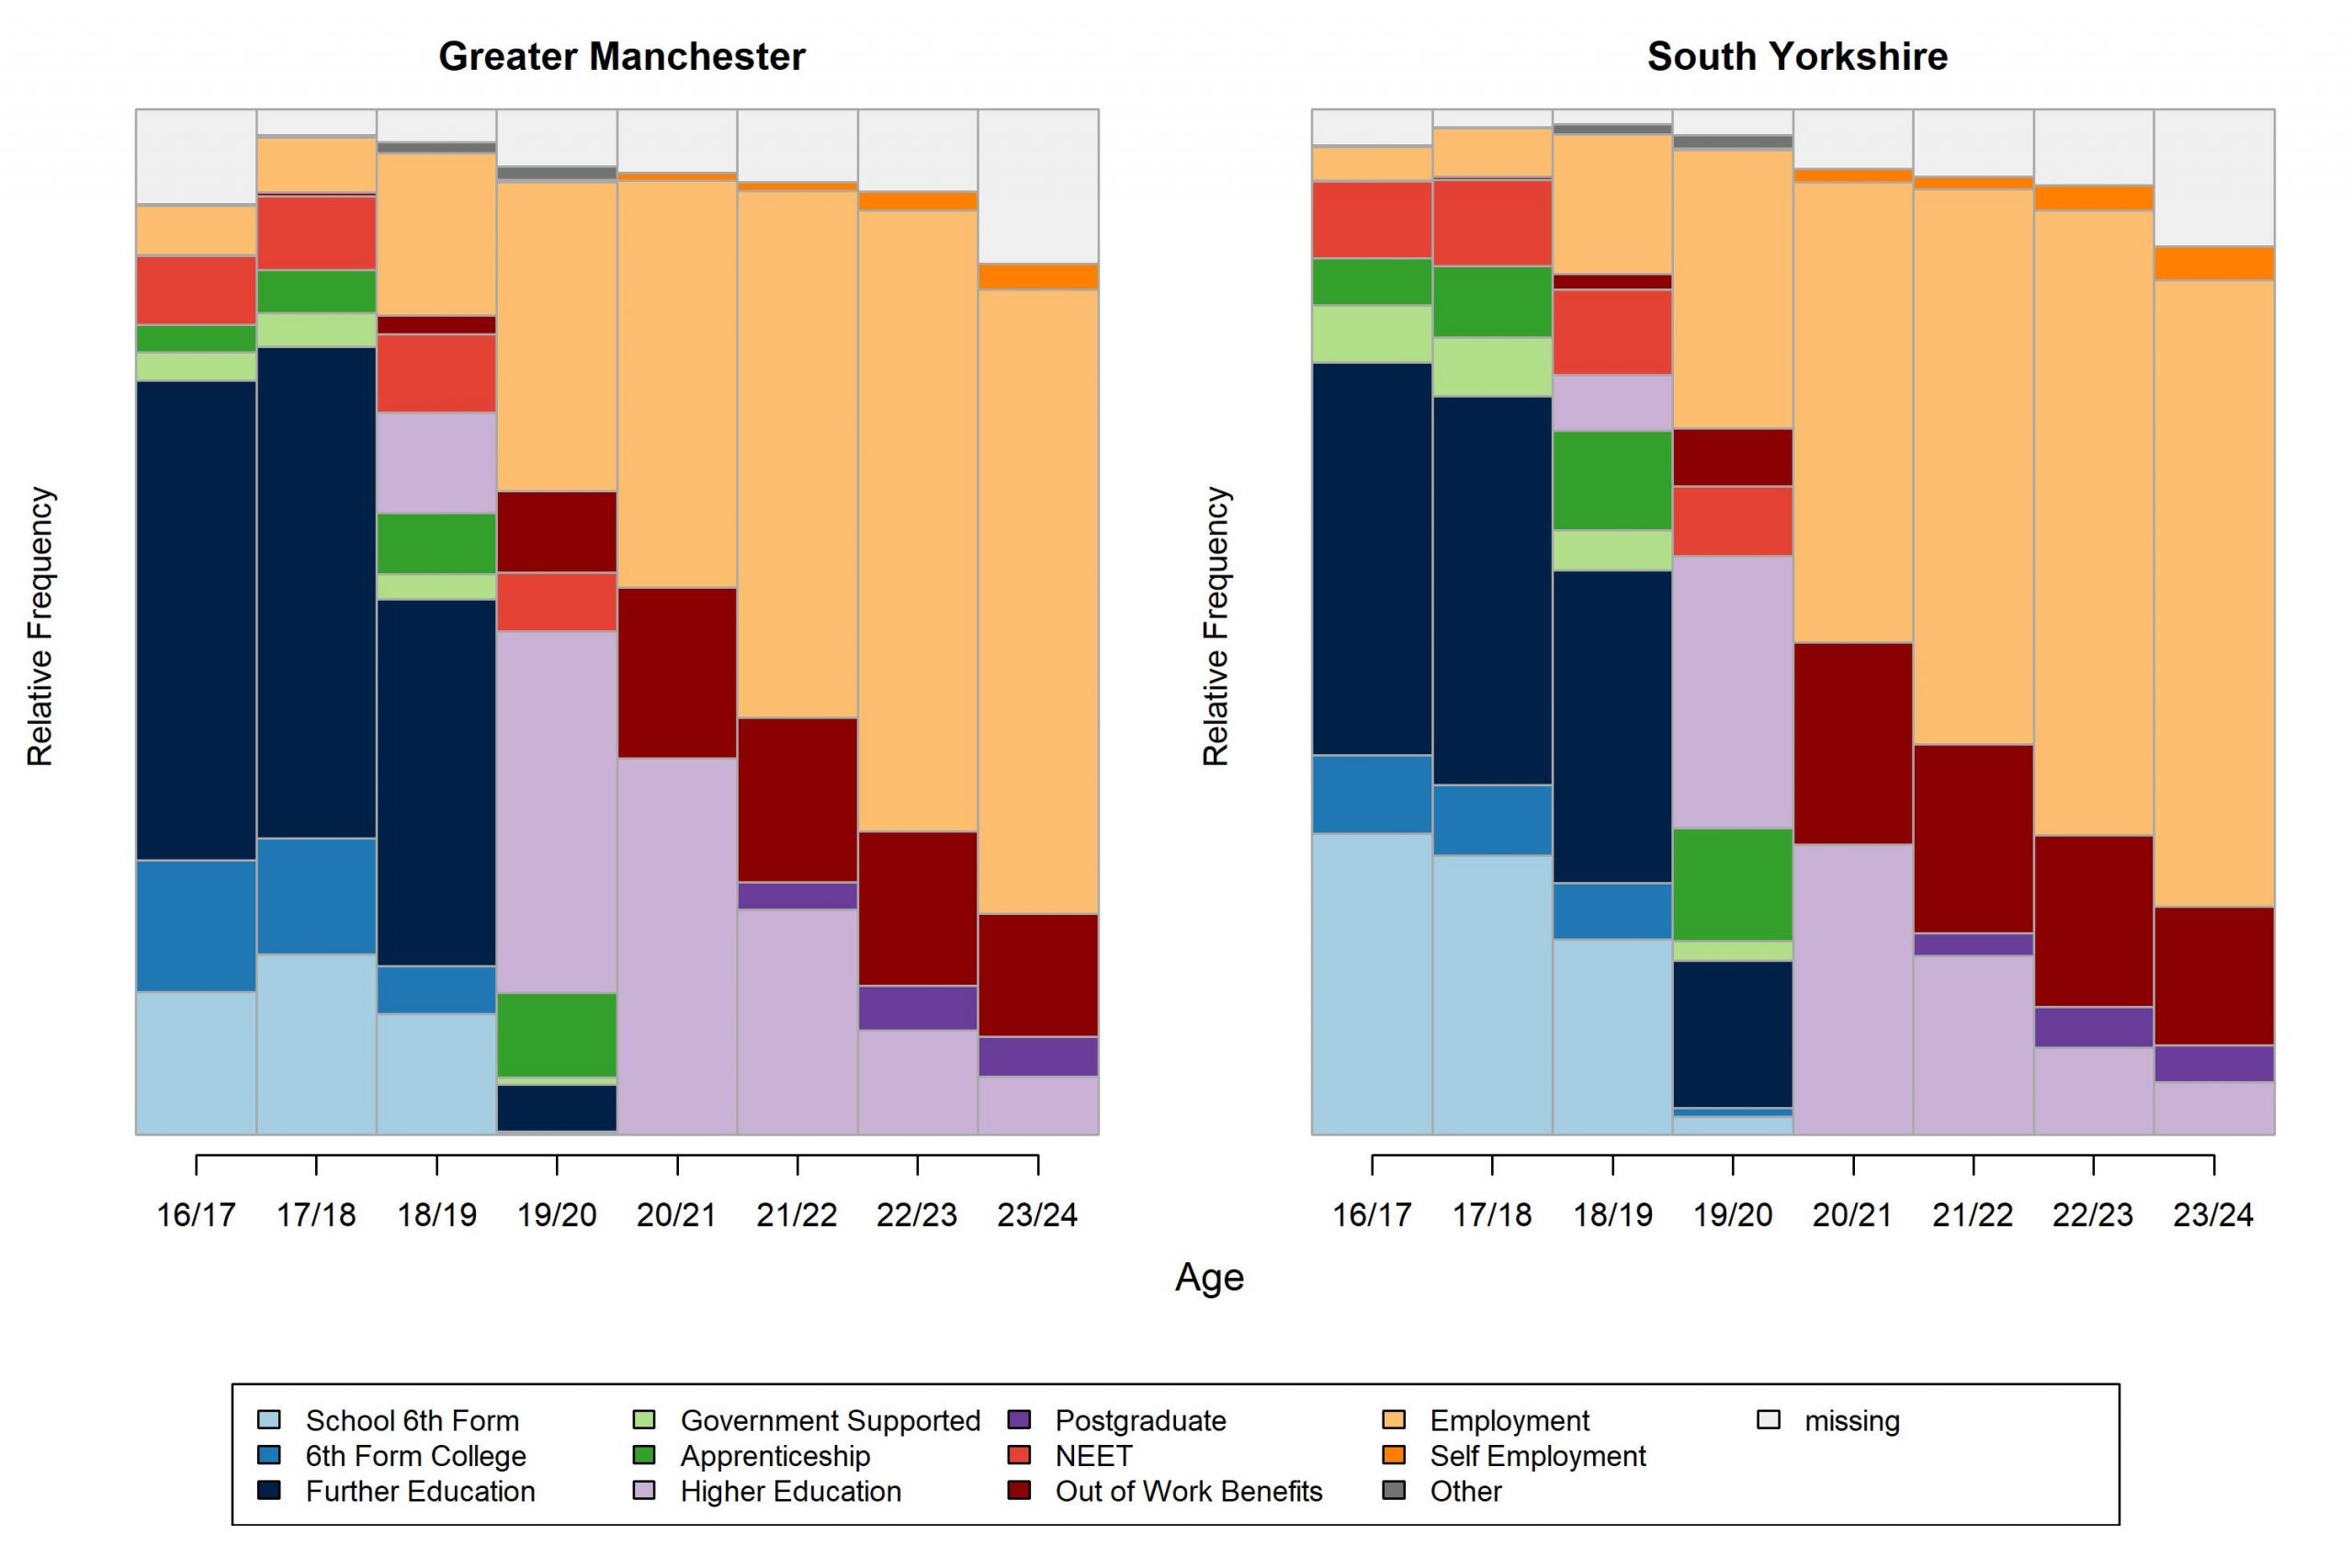
Figure A7: Cluster Quality Analysis – Average Silhouette Width (ASW) and Pseudo R2 Values for Various Cluster Numbers for the Pooled South Yorkshire and Greater Manchester 2010/11 School-leaver Cohort (n = 44,600)
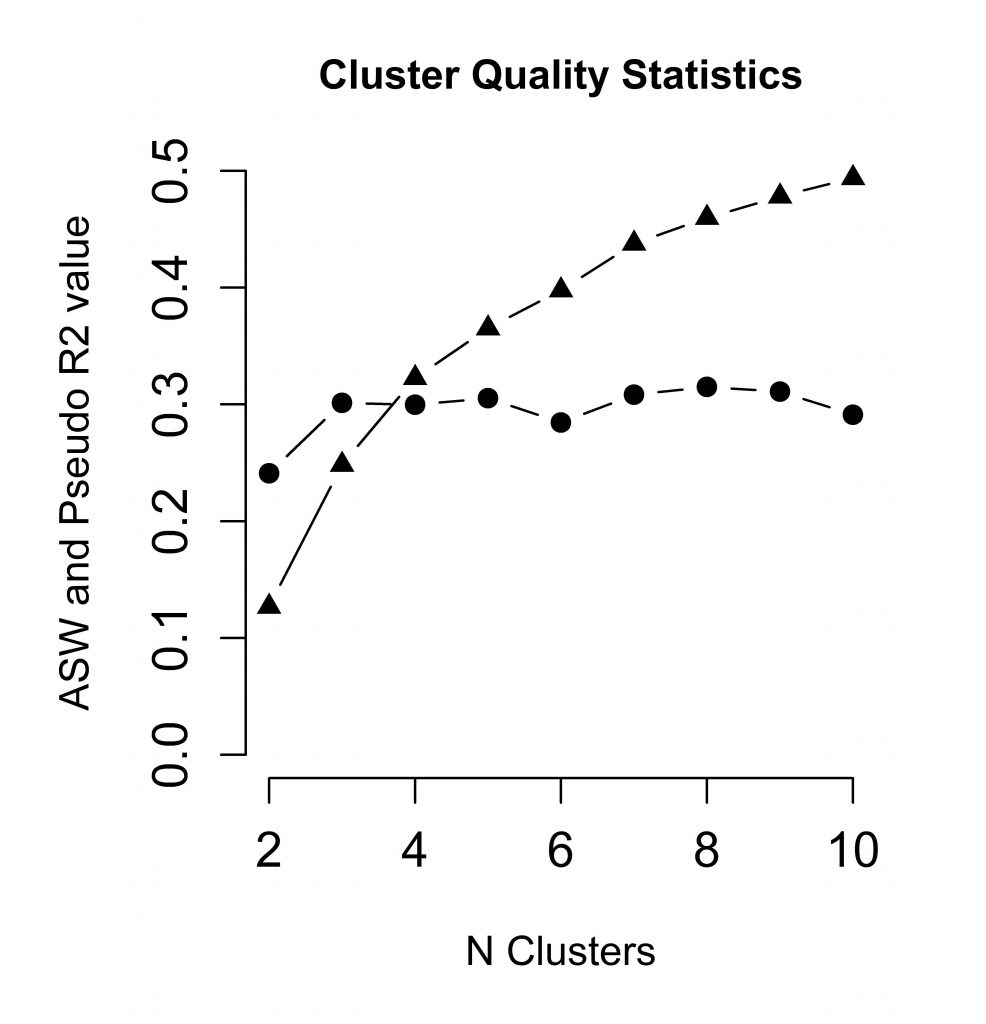
To determine the optimal number of clusters, cluster quality analysis was conducted for k=2 to k=10. The statistics used to identify the optimal k were the Average Silhouette Width (ASW) and the pseudo R2 values. The ASW assesses the coherence of the cluster members, where a high coherence indicates better between-group differences and stronger within-group similarities. The Pseudo R2 measures the total proportion of discrepancy explained by the clustering solution and should be maximised (Raab & Struffolino, 2022, p. 92). From the above figure, the ASW had maximum values at k=3, k=5, k=7, k=8 and k=9. The pseudo R2 value should gradually increase as k increases. At k=8 and k=9, the ASW had minimal increase and offered little benefit compared to k=7. Therefore, to maximise both the ASW and the Pseudo R2 values, I identified k=7 as the most optimal cluster number for the analysis.
Figure A8: Activity State Distribution Plots Showing the Relative Frequency of each Activity State per year for the Pooled 2010/11 School-leavers (n = 44, 600), Split by Cluster
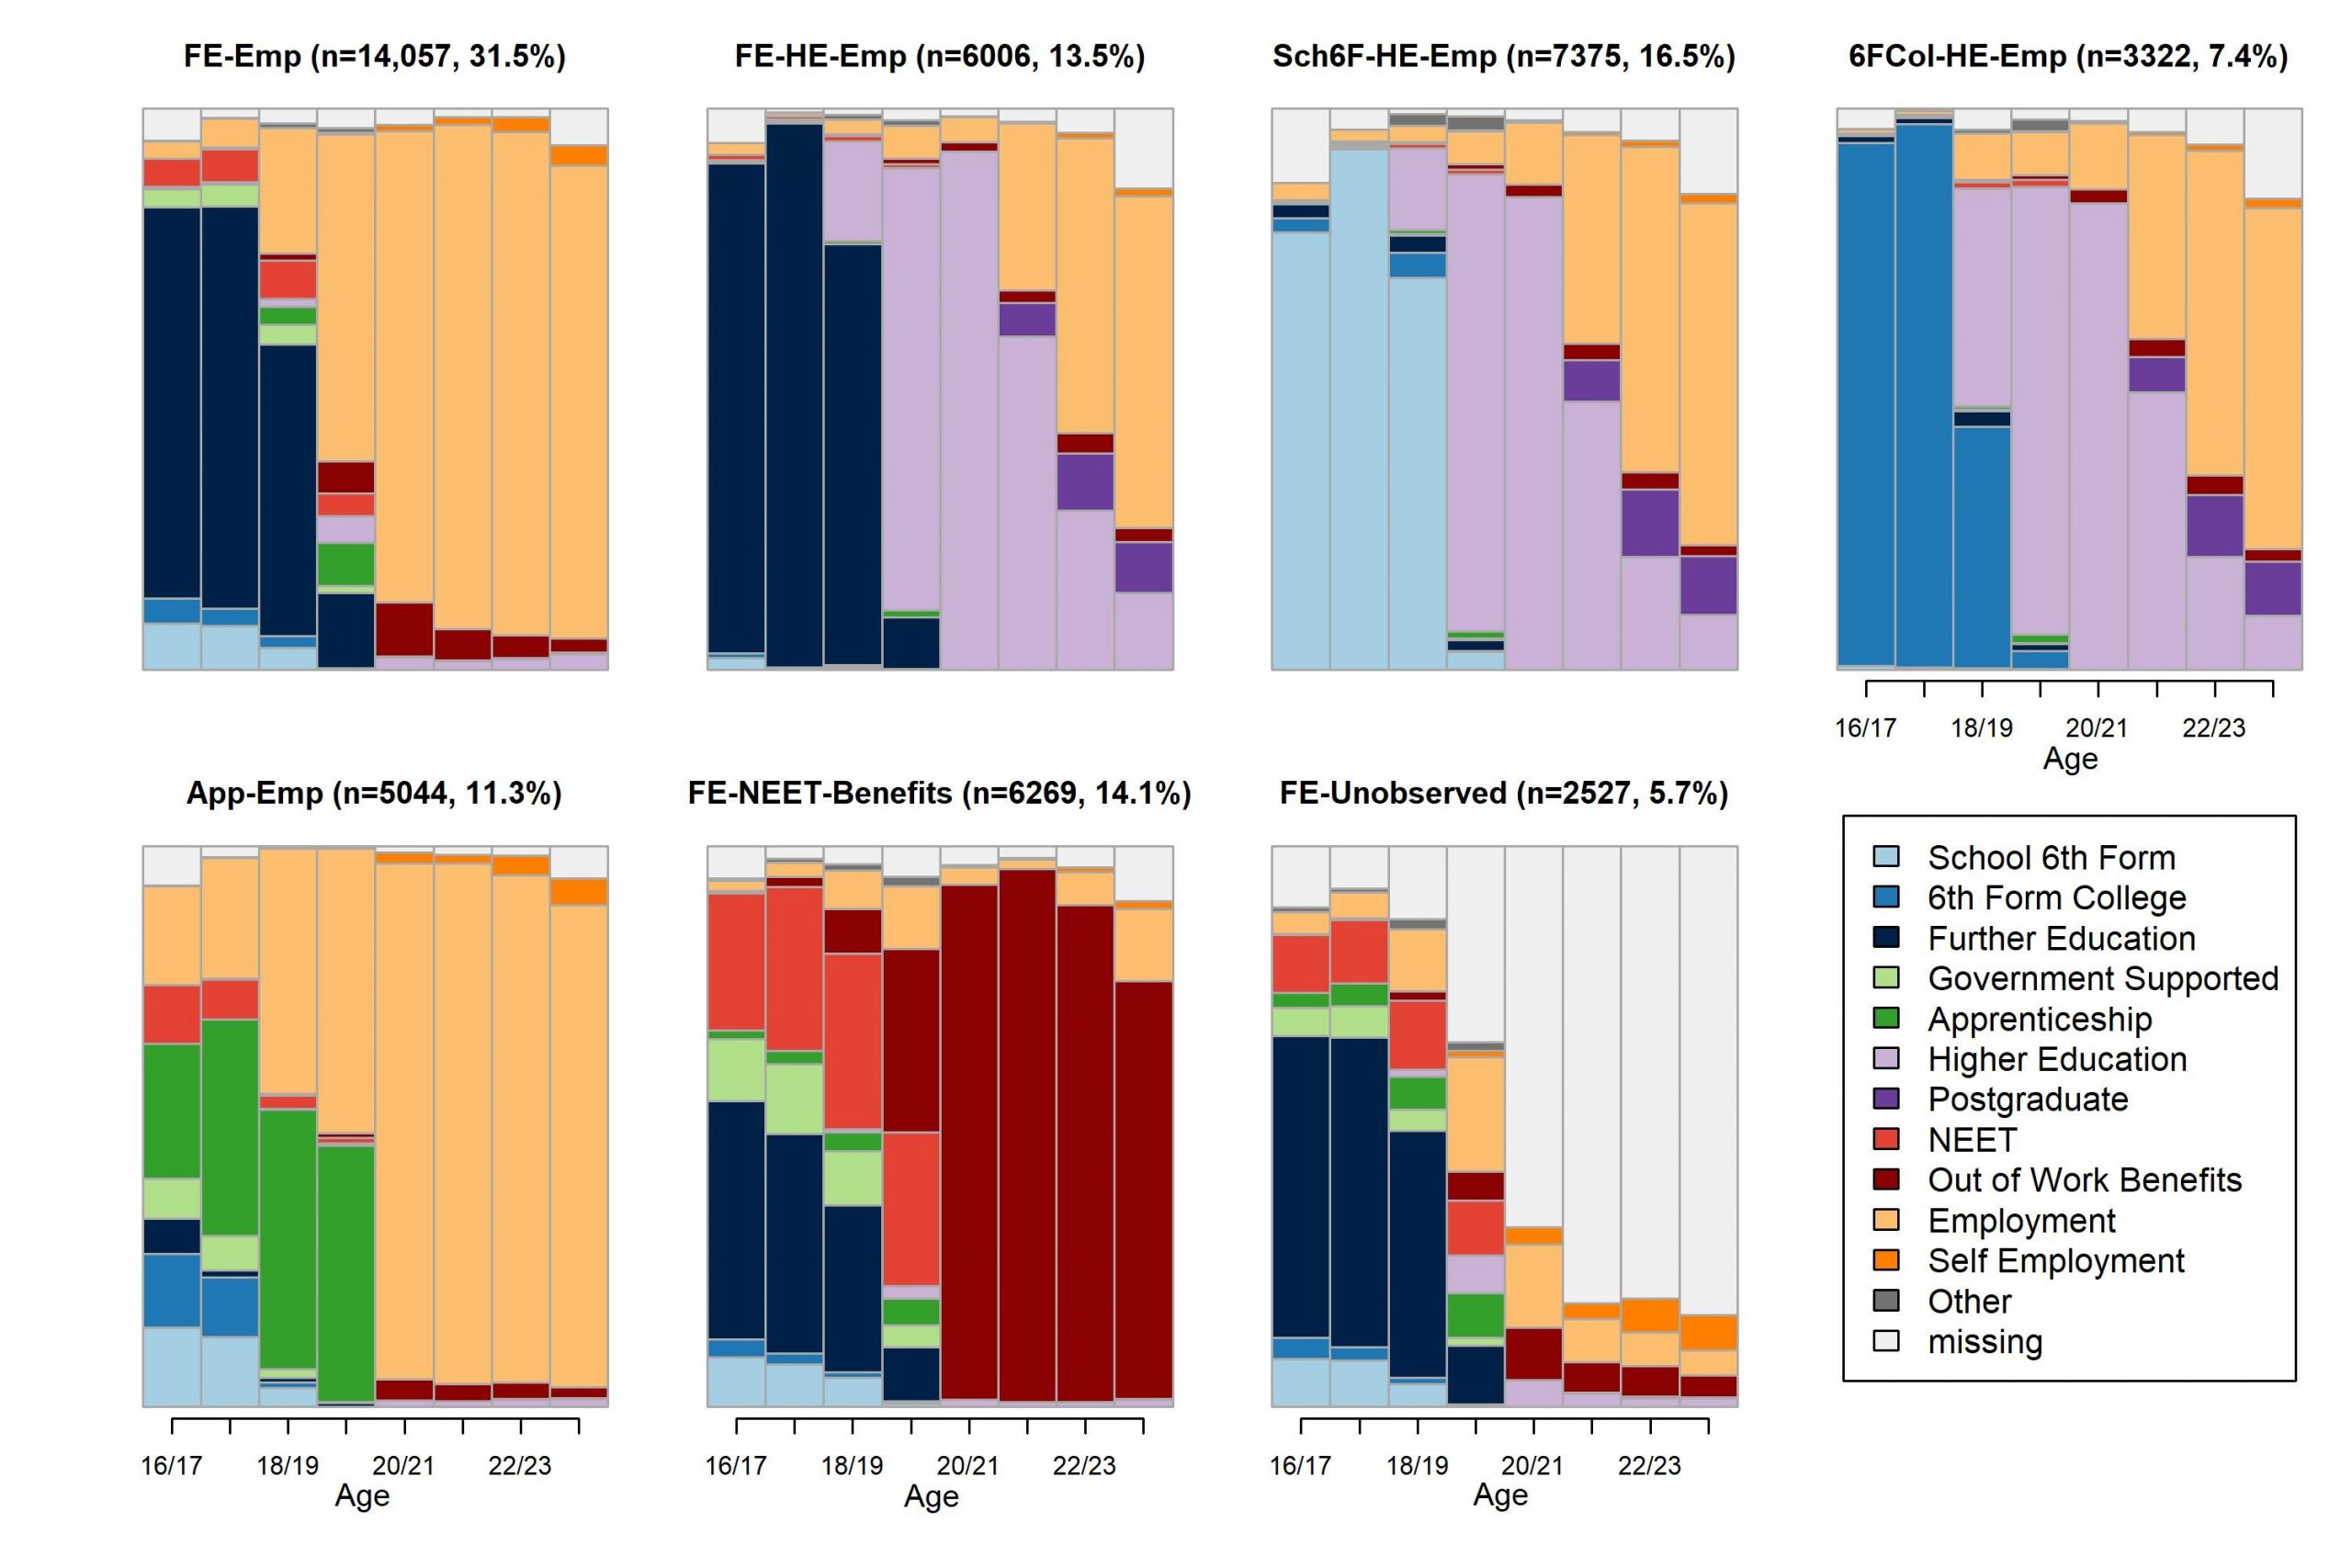
Figure A9: Post-16 Education Establishments in Greater Manchester and South Yorkshire, 2024
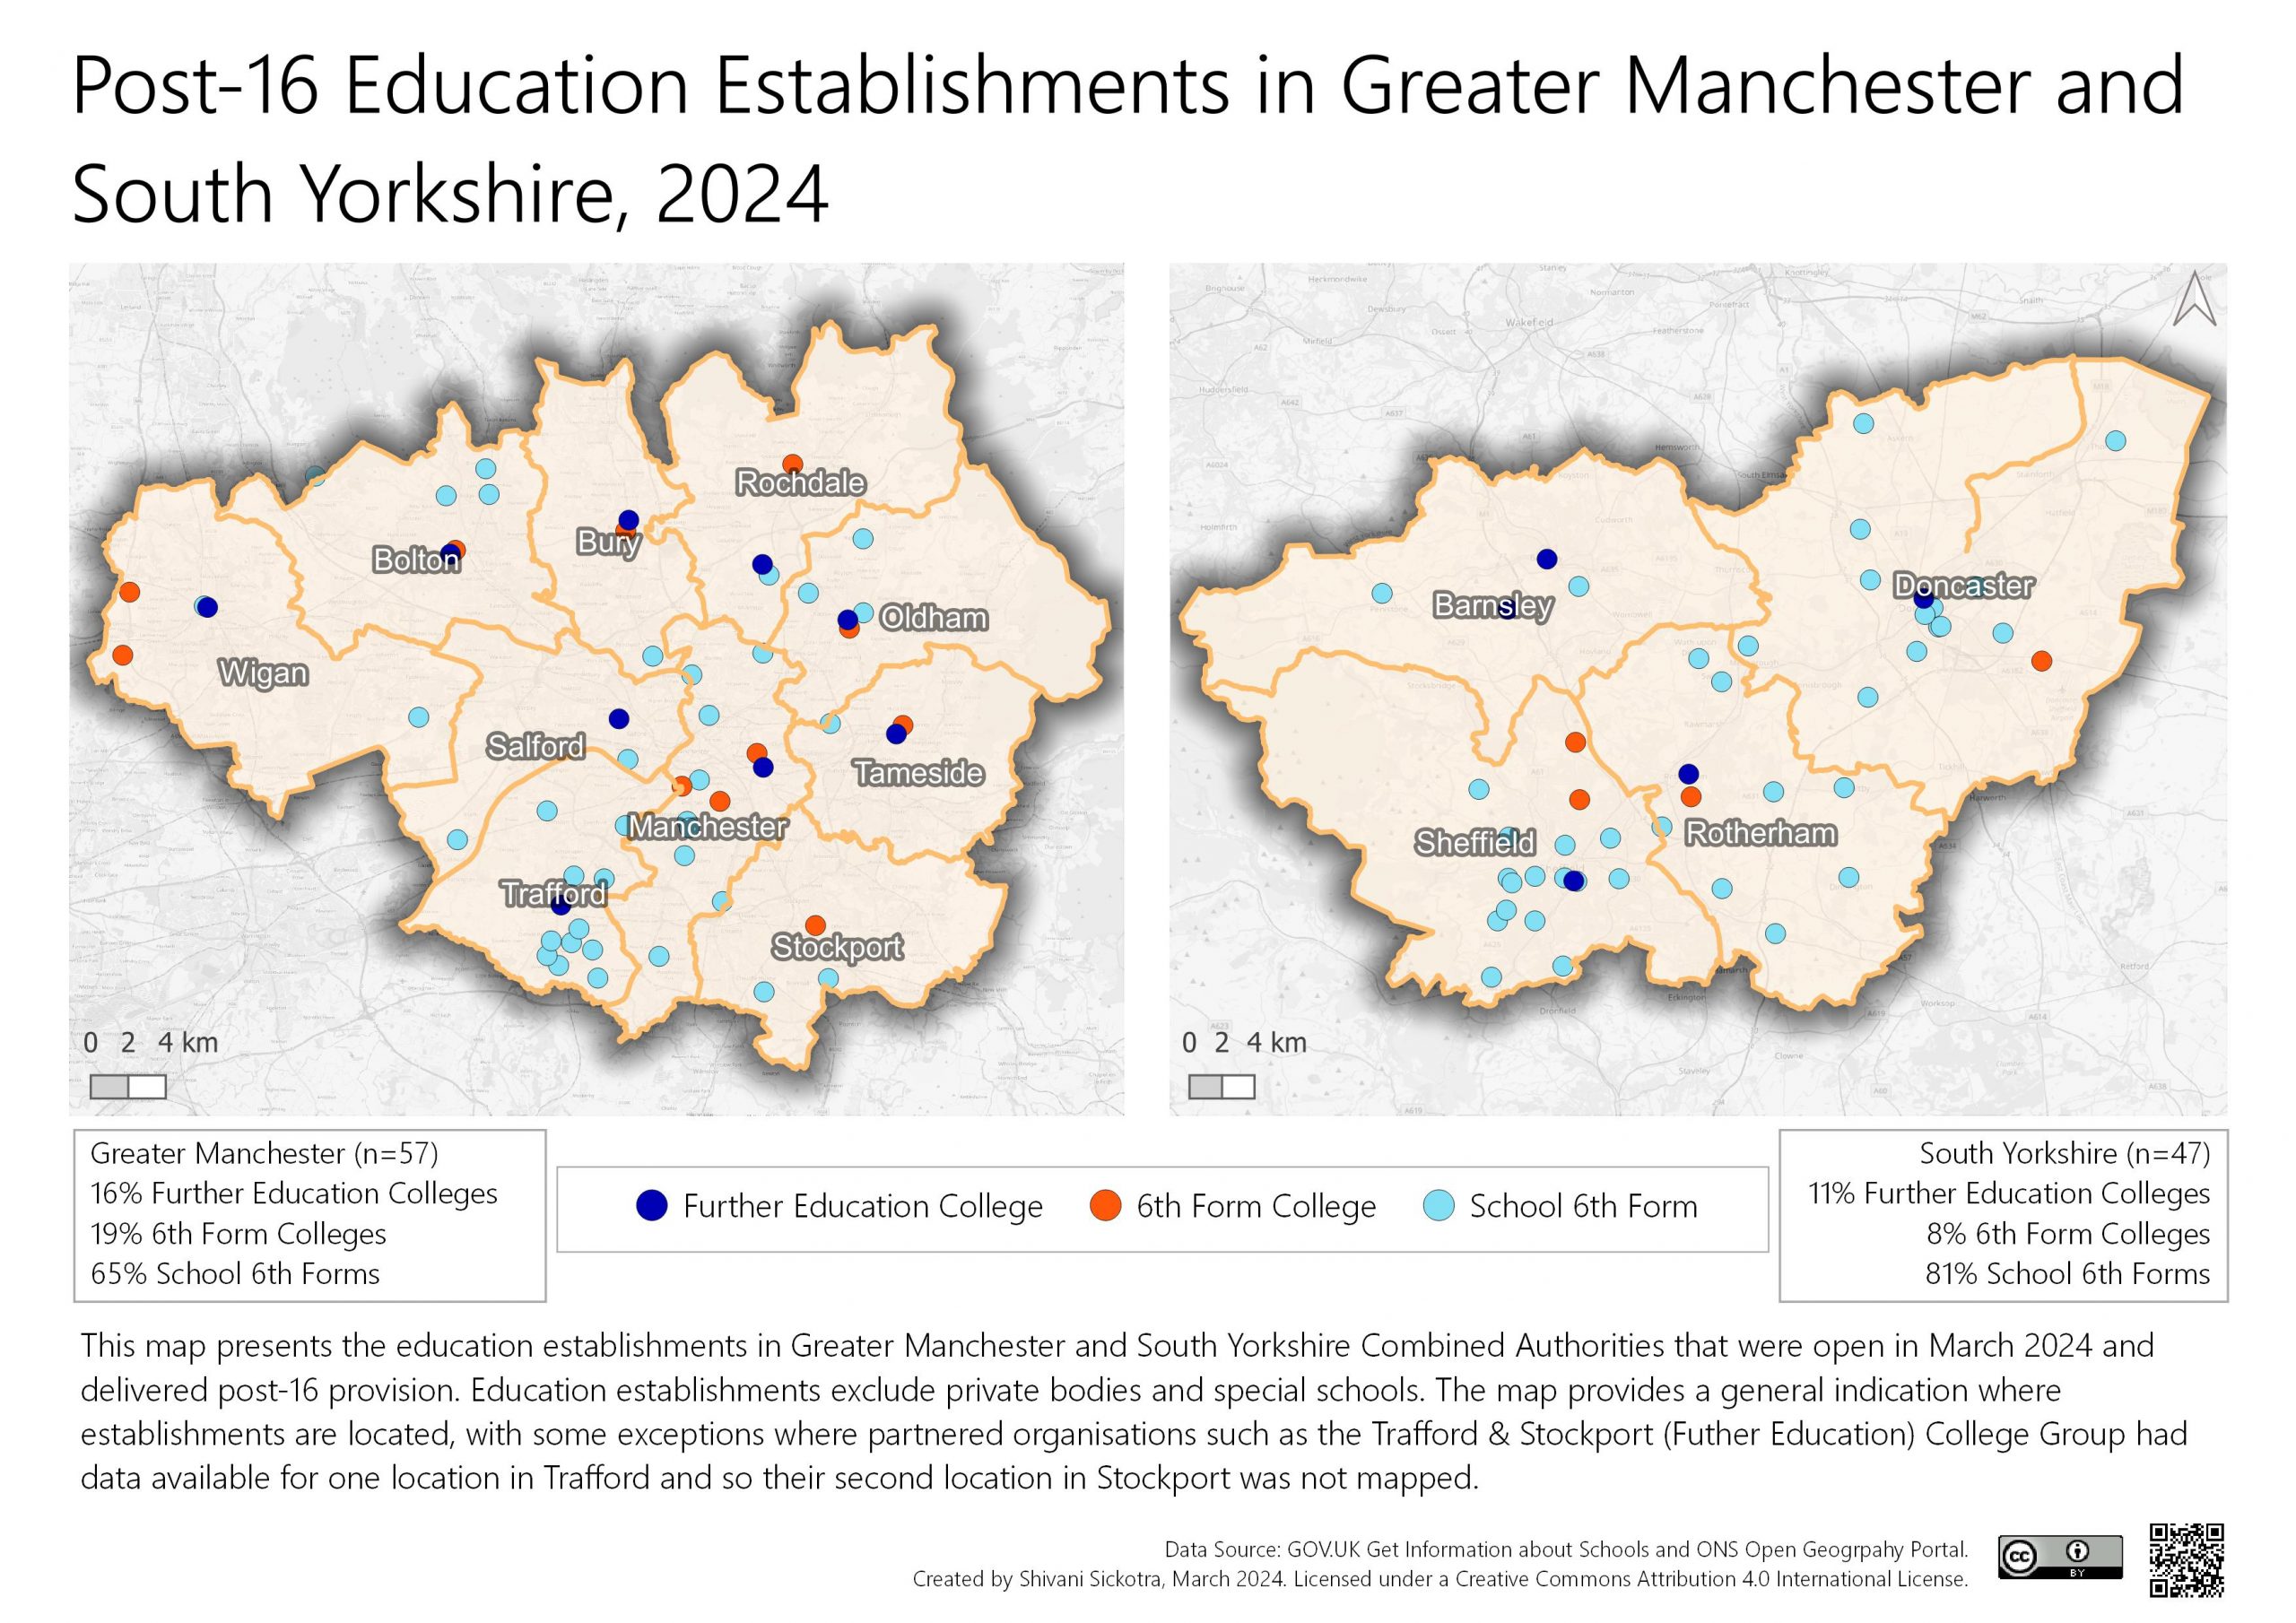
Source: Produced by the author using data from GOV.UK Get information about Schools and Office for National Statistics (Open Geography Portal), licensed under the Open Government Licence v.3.0. Contains OS data © Crown copyright and database right 2021.
Figure A10: Education, Training and Skills Deprivation in Greater Manchester and South Yorkshire, 2010 and 2019
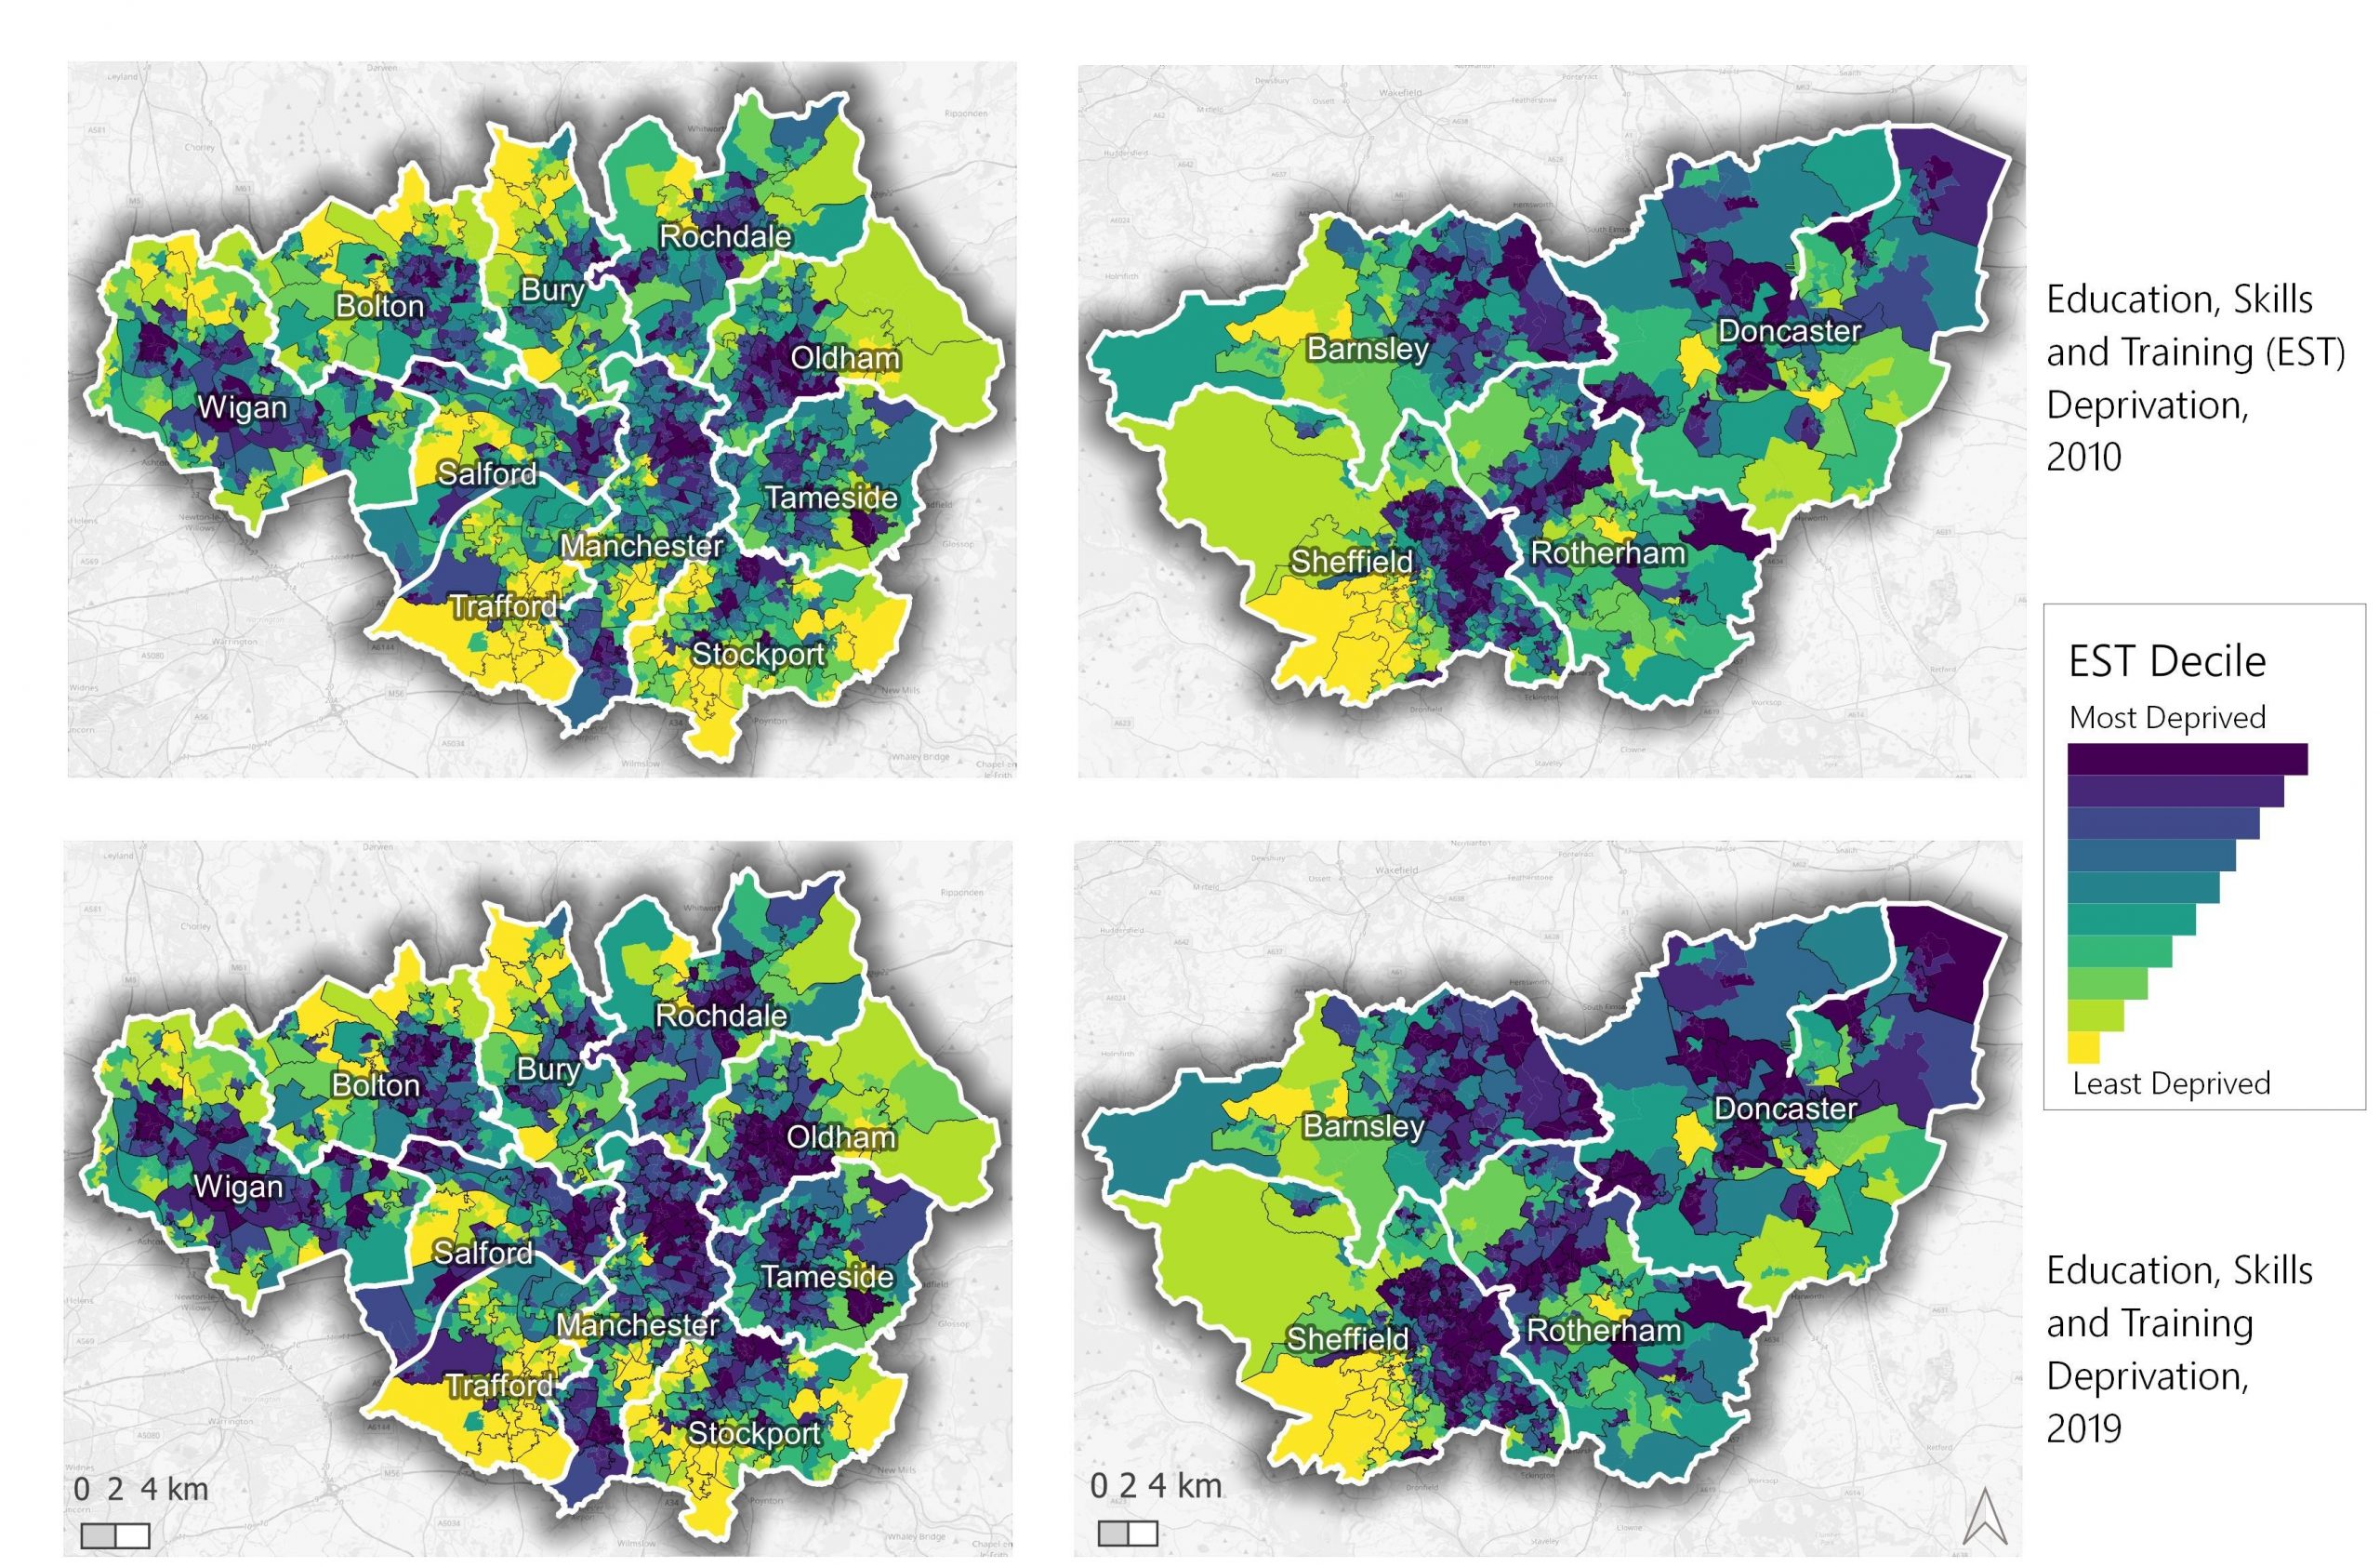
Source: Produced by the author using data from Ministry of Housing, Communities and Local Government, Indices of Multiple Deprivation 2010 and 2019, and Office for National Statistics (Open Geography Portal), licensed under the Open Government Licence v.3.0. Contains OS data © Crown copyright and database right 2021. Inspired by the Education, Skills and Training Deprivation 2019 mapping in SYMCA created by the author (Author, Year).
Multinomial Logistic Regression
Indicators for individuals who were recorded as receiving any SEN provision at school-leaving age and if they were ever eligible to FSM after nursery were created. GCSE attainment was measured by the criteria of achieving 5 or more A*-C grade GCSEs or Level 2 equivalents, including GCSE English and Maths. The IDACI variable indicated whether an individuals’ LSOA was within the 10% most nationally deprived. The IDACI is a subset of the Income Deprivation Domain in the Indices of Multiple Deprivation and is a measure of the proportion of children under 16 living in low-income households. This was used as a proxy for early childhood hardship that can impact future school-to-work trajectories (Edmunds, 2020). These characteristics were true for the individuals at school-leaving age in the 2010/11 academic year, excluding the IDACI variable as 2015 was the earliest available data. Prior to performing MLR, the associations between these were checked to ensure none were strongly correlated.
Figure A11: Regression Analysis Exploratory Variable Associations Heatmap for Pooled South Yorkshire and Greater Manchester 2010/11 School Leaver Cohort
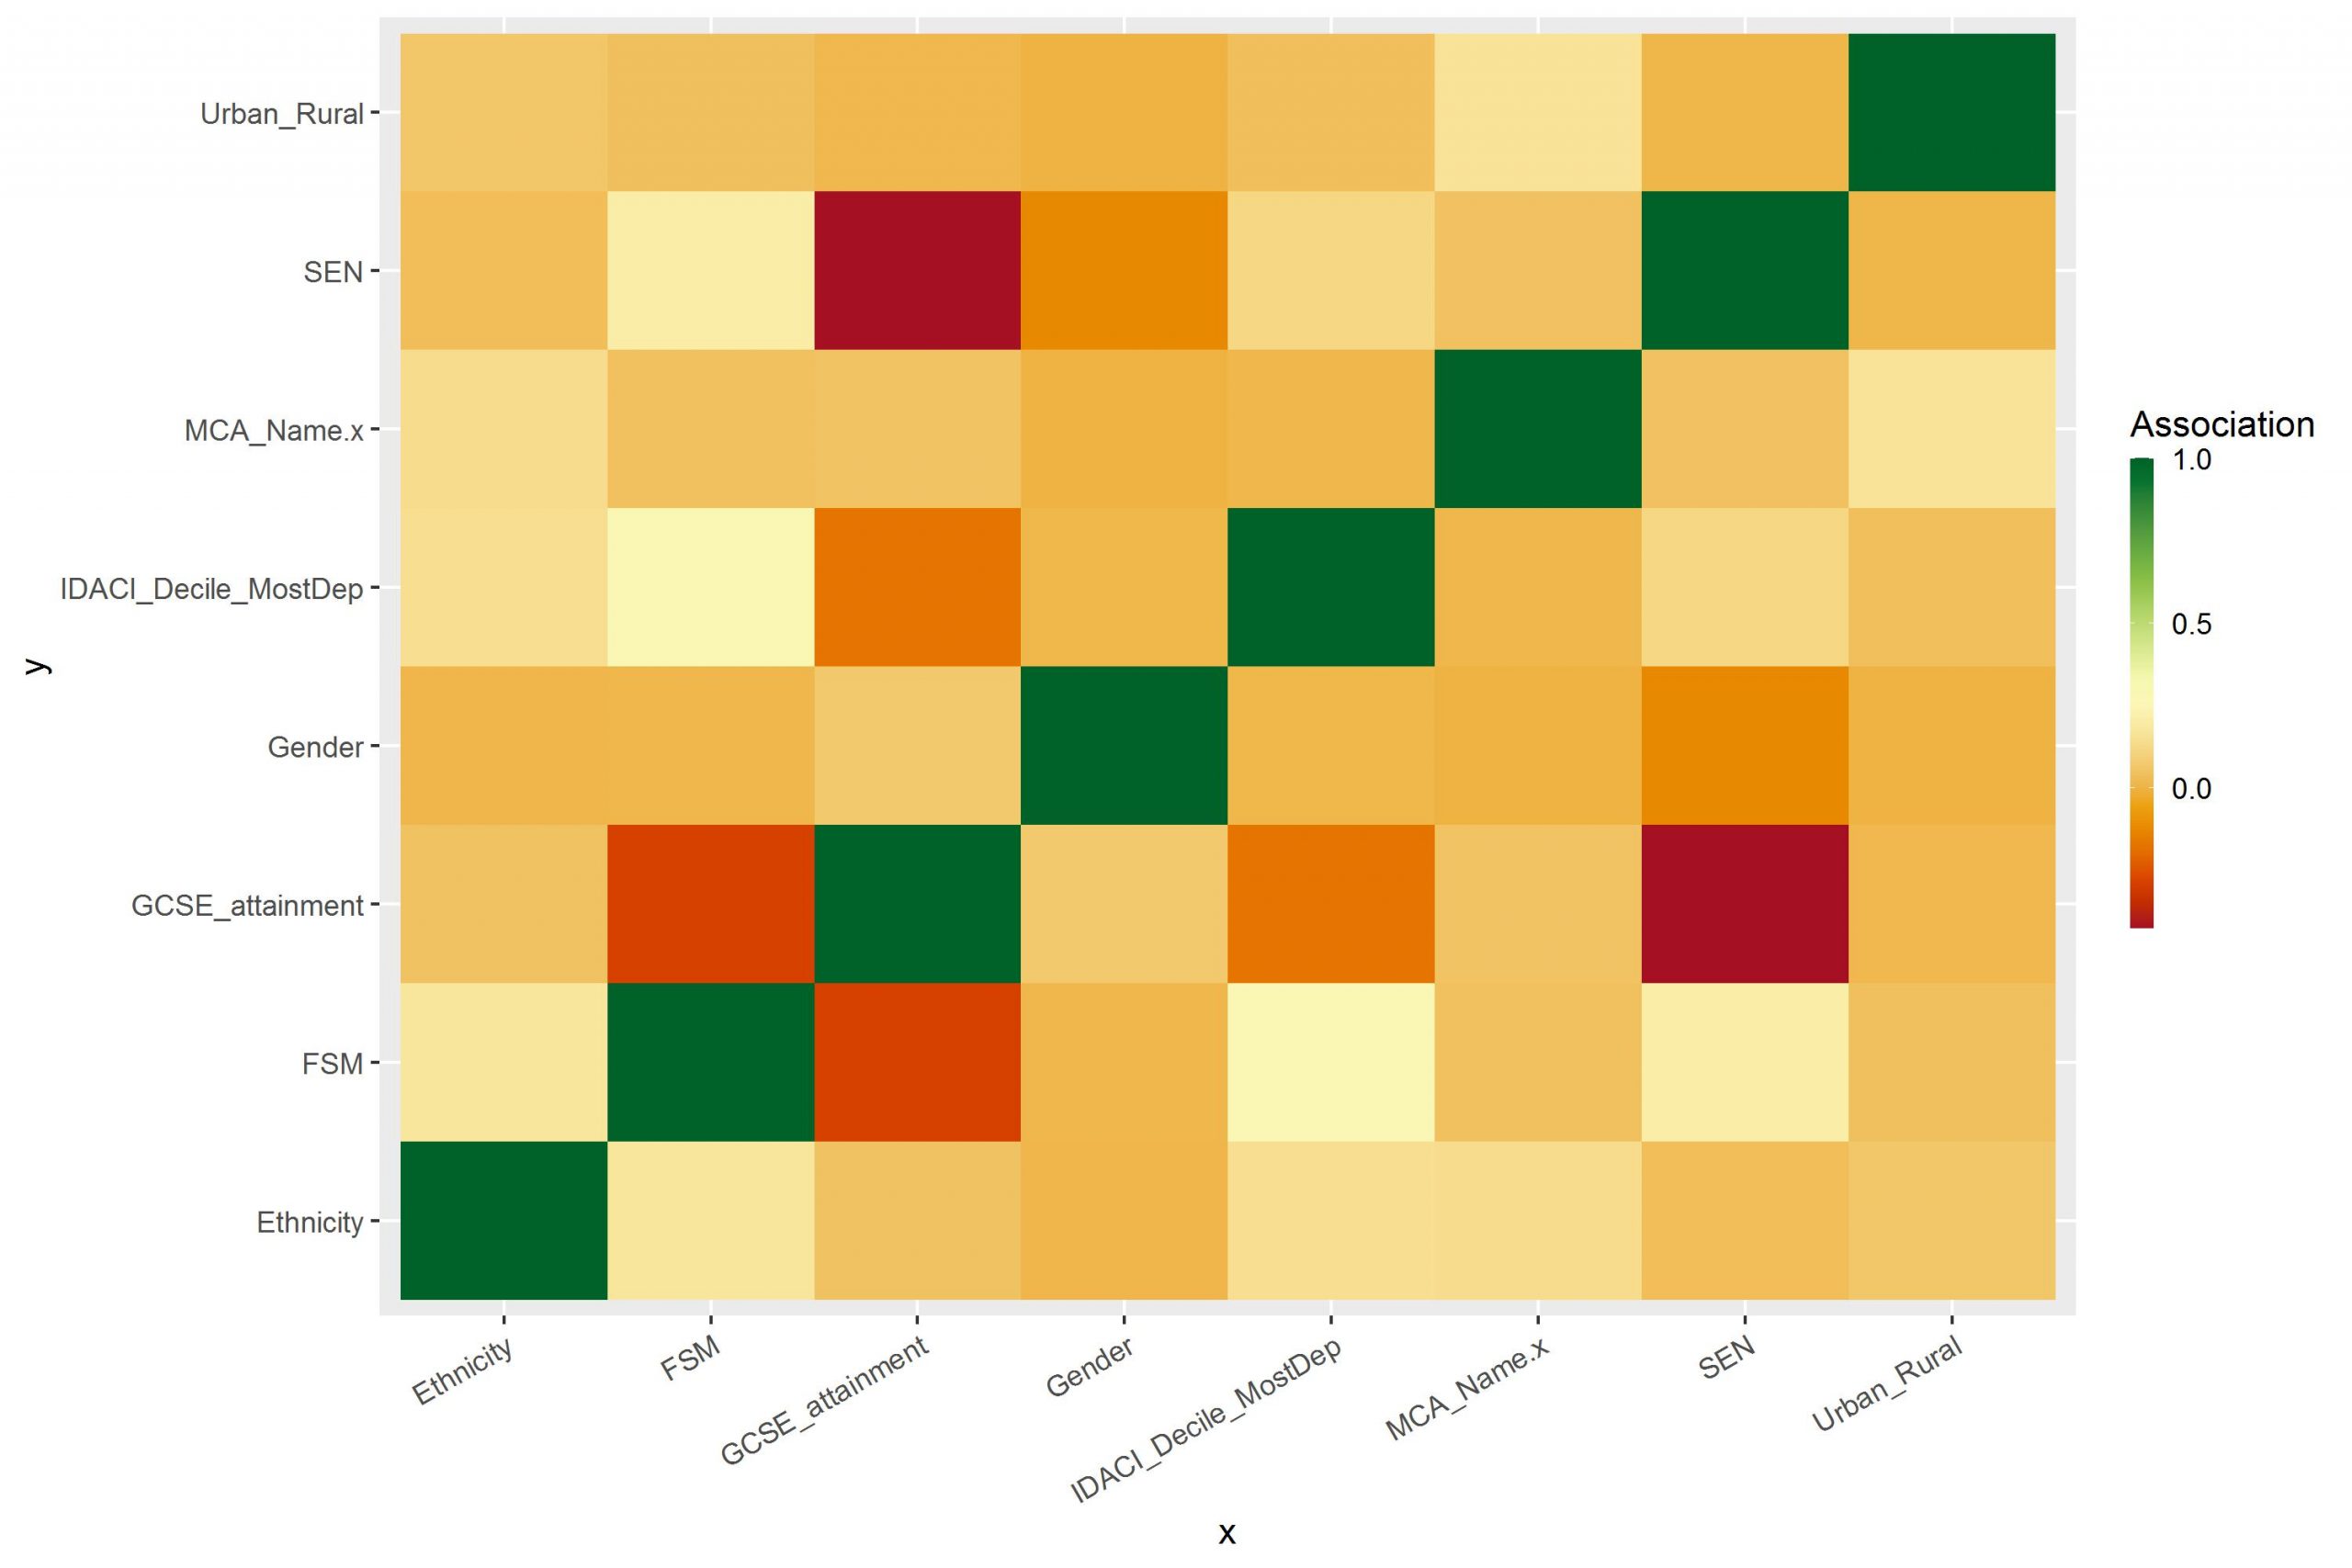
Pairwise association between all variables, where nominal vs nominal was calculated using the Chi-square test, numeric vs numeric with Pearson correlation coefficient and nominal vs numeric with ANOVA.