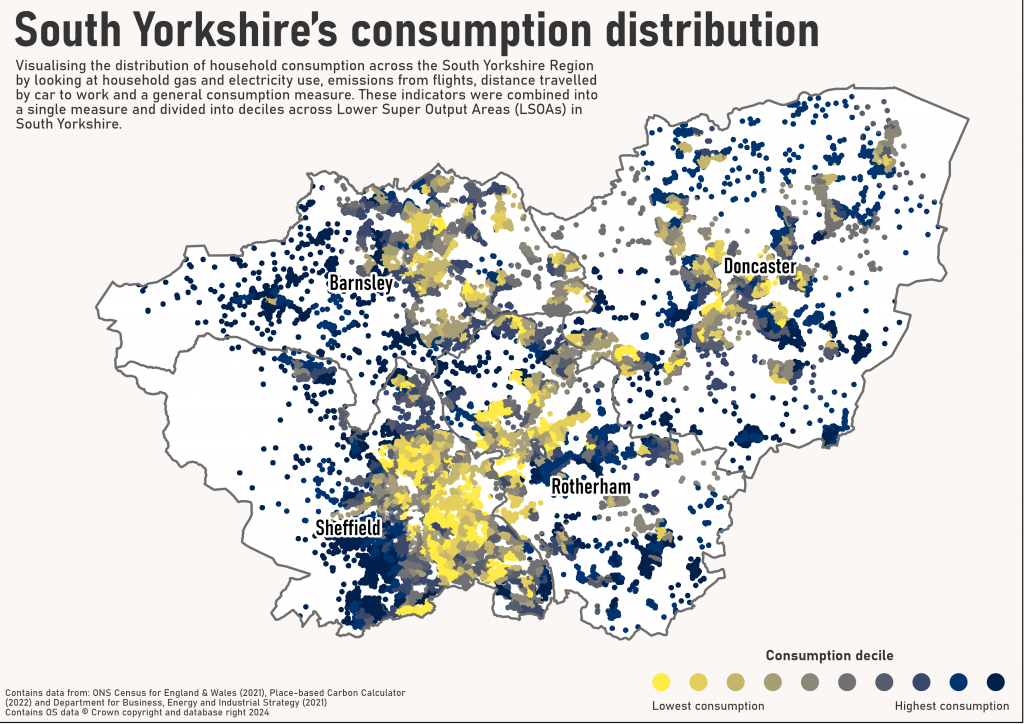
The purpose of this graphic is to visually represent the distribution of household consumption across the South Yorkshire region. The double-bind of social inequality and the climate crisis has increased interest in unequal levels of household consumption (Garcia et al., 2021). In the UK 37 per cent of total emissions can be attributed to the richest 25 per cent of households, which contrasts with 15 per cent emitted by the poorest 25 per cent (Büchs & Schnepf, 2013). These differences are stark, yet solely increasing consumption of those under-consuming without addressing high consumers simply leads to increased total emissions. In South Yorkshire, a more equitable approach to resource distribution is needed if the South Yorkshire Mayoral Authority’s purpose of creating a stronger, greener and fairer region (Sulley, 2022) is to be achieved. To do that, current resource use across the region needs to be understood.
Consumption patterns illustrated by this graphic includes household gas and electricity use (average kilowatt-hour per meter), per capita emissions from flights, distance travelled by car to work and a measure of general consumption including food, goods and services. These domains represent core consumption categories of domestic energy, travel, diet, and goods and services. Calculating the entirety of a household’s consumption is complex, requiring data not readily available. Instead, we explore spatial differences and inequalities of consumption across one region of the UK at the Lower Super Output Area (LSOA) level.
This graphic demonstrates that consumption inequality is not just a national (Owen & Barrett, 2020) or global (Ritchie, 2019) issue, but witnessed regionally in the towns and cities of South Yorkshire. Resource use of South Yorkshire’s top consuming LSOA’s is substantially higher than the lowest, with comparatively high consumption across multiple categories. LSOA’s with the highest gas usage consume more than three times that of the lowest. In other categories the difference is more pronounced with the top deciles emissions from flights being ten times higher than those in the bottom.
Spatially, the graphic indicates high consuming LSOA’s are distributed across the region, however two notable patterns can be unpicked. Firstly, there is a rural/urban split. Several of the top consuming LSOAs are in rural, sparsely populated locations which may indicate that these households have a higher dependency on consumption owing to their remote location. Those located in rural areas of Barnsley, Rotherham and Doncaster have higher levels of car use, likely due in part to limited public transport leading to a dependence on private vehicles. Additionally, rural locations typically have higher percentages of detached or pre-1919 homes where lower energy efficiency makes them harder to keep warm (DEFRA, 2024).
Secondly, analysis underlines the role of income in consumption levels, with higher consumption correlating with higher income. In Sheffield, where there is a known split between the more affluent west of the city and the more economically deprived east, the graphic shows a clear demarcation with consumption levels following this same trend. Typically, high consumption can be seen in more affluent areas. This is likely due to the financial means to, not only purchase (larger) resource intensive homes, but consume more readily across categories. Previous analysis has linked higher levels of domestic energy use in larger homes to increased floorspace (Chatterton et al., 2016) and more appliances (Jones & Lomas, 2015).
Disentangling income from consumption, particularly where levels of consumption go beyond that which is ‘sufficient’ for good quality of life (Darby & Fawcett, 2018) remains a complex challenge, yet unpicking where high consumers are located is an important step towards understand how consumption can be rebalanced.
This graphic has been produced by applying a point density mask layer to [hide] more sparsely populated areas and help focus the narrative of the map to areas where the most people live. To achieve this, an extract was taken from the Post Office Delivery Point dataset for all Postcodes in South Yorkshire. This was filtered by domestic delivery points, imported into ArcMap and converted to XY coordinates. From new layer was used as the input point feature in the Point Density tool to create a circle with a radius of 200 square metres around each delivery point to create a new Raster layer. Finally, the default symbology of this layer was changed by setting the Primary Symbology type to stretch and setting the colour scheme to 100 per cent transparent and under the mask tab ticking the ‘Display background value” to white. When this new ‘mask’ is overlayed on top of the Consumption feature, only areas within the point density circles are displayed.
This research has been conducted as part of a broader programme of research into high consumers, which is part funded by the South Yorkshire Sustainability Centre. In addition to the authors, the project also involves: Aimee Ambrose, Anna Hawkins, Mia Rafalowicz-Campbell, and Alvaro Castano Garcia.
Amy Grace, Centre for Regional, Economic and Social Research, Sheffield Hallam University, City Campus, Charles Street, Sheffield S1 1WB. Email: a.grace@shu.ac.uk
Büchs, M., & Schnepf, S.V. (2013). Who emits most? Associations between socio-economic factors and UK households’ home energy, transport, indirect and total CO2 emissions. Ecological Economics, 90, 114-123. CrossRef link
Chatterton, T.J., Anable, J., Barnes, J., & Yeboah, G. (2016). Mapping household direct energy consumption in the United Kingdom to provide a new perspective on energy justice. Energy Research & Social Science, 18, 71-87. CrossRef link
Darby, S., & Fawcett, T. (2018). Energy sufficiency: an introduction. Concept Paper. Stockholm: European Council for an Energy Efficient Economy. https://www.energysufficiency.org/static/media/uploads/site-8/library/papers/sufficiency-introduction-final-oct2018.pdf
Department for Environment, Food & Rural Affairs (DEFRA) (2024). Statistic Digest for Rural England: 2 – Housing. https://assets.publishing.service.gov.uk/media/65ef7140133c220019cd37d2/2_Housing_12_03_2024.pdf
Garcia, A. C., Ambrose, A., Hawkins, A., & Parkes, S. (2021). High consumption, an unsustainable habit that needs more attention. Energy research & social science, 80, 102241. CrossRef link
Jones, R.V., & Lomas, K.J. (2015). Determinants of high electrical energy demand in UK homes: Socio-economic and dwelling characteristics. Energy and Buildings, 101, 24-34. CrossRef link
Owen, A., & Barrett, J. (2020). Reducing inequality resulting from UK low-carbon policy. Climate Policy, 20(10), 1193-1208. CrossRef link
Ritchie, H. (2019). Who has contributed most to global CO2 emissions? Published online at OurWorldInData.org. https://ourworldindata.org/contributed-most-global-co2
Sulley, R. (2022). Achieving a Net Zero economy by 2040 in the South Yorkshire Strategic Economic Plan – webinar. https://southyorkshire-ca.gov.uk/explore_green-campaign