This paper explores three themes central to the Coalition Government’s agenda for a ‘Big Society”: power and empowerment; participation and involvement; and civil society. The paper draws on national datasets to explore the variation in these themes across the local authority districts of Yorkshire and the Humber, and as such presents a baseline assessment against which to measure change as policies underpinning the Big Society are rolled out. Unsurprisingly, the paper highlights significant variation across Yorkshire and the Humber, and in particular the lower levels of civic involvement in poorer districts.
Two central points shape the conclusion: firstly that public expenditure cuts will lead to a loss of civic society organisations, to job losses in the sector and a withdrawal of services and with this the possibility for opportunities to participate; and that current policy design places too much emphasis on the contribution civil society can make to improving policy outcomes.
Introduction
This paper presents an analysis of civil society and involvement in Yorkshire and Humber and in so doing seeks to provide a broad assessment of ‘Big Society’, the policy agenda of Conservative-Liberal Democrat Coalition Government. However, the paper is not an evaluation of policies, strategies, funding or actions which may promote a Big Society. Rather its focus is to consider the differences which exist between places in terms of social action.
The Office for Civil Society, the government unit tasked with designing and coordinating Big Society policy, has published a strategy document Building a Stronger Civil Society (Cabinet Office, 2010). Amongst themes of devolution and transparency of information are three components seen as central to building a Big Society:
- Empowering Communities: giving local councils and neighbourhoods more power to take decisions and shape their area.
- Promoting social action: encouraging and enabling people from all walks of life to play a more active part in society, and promoting more volunteering and philanthropy.
- Opening up public services: the Government’s public service reforms will enable charities, social enterprises, private companies and employee-owned co-operatives to compete to offer people high quality services.
- Such reforms, the strategy highlights, will radically re-cast the relationship between the state and charities, social enterprises and voluntary and community groups over the coming years.
This paper provides an assessment of these three aspects of the Big Society in one region, Yorkshire and the Humber, under the headings provided by the Office for Civil Society: power and empowerment, participation and involvement and civil society organisations. The paper draws on national datasets which can be analysed at a local authority (LAD) level (where possible to lower tier authorities). As such the paper is also interested in a fourth theme, place. The paper provides an initial baseline assessment of the Big Society, and if it’s associated policy agenda is a success (in five or ten years’ time as David Cameron suggests), then positive change would be expected against these core indicators. The paper is not intended to be an exhaustive analysis of indicators, but rather an introduction to understanding and measuring the Big Society, and the problems it faces as a coherent political strategy.
About the Yorkshire and Humber Case Study Region
Yorkshire and Humber is used to illustrate the diversity of civil society between places. This region, as with others in England, has a balance between urban and rural areas and quite considerable place-based diversity in levels of deprivation and prosperity. It may also be argued that civil society, and in particular voluntary and community sector organisations, have been a key focus for regeneration and economic development policy interventions since the mid 1990s (Armstrong and Wells, 2006). Nonetheless, as the Civil Society Almanac 2010 (Clark et al., 2010) shows, Yorkshire and the Humber has fewer similar society organisations (2.1 per 1,000 of the population) than six of the eight other regions. Indeed, the South West, East of England, South East and London all have over three organisations per 1,000 of the population.
To set the scene for the analysis of civil society in the following sections, it is worth highlighting some of the main socio-economic variations across the region. Primarily using the Index of Multiple Deprivation (IMD) we undertook analysis at two levels, firstly for the local authority districts, and secondly on the concentration of most and least deprived ‘lower super output areas’ (LSOAs) within each local authority district.
Figure 1 shows the IMD score for each local authority district (LAD) in Yorkshire and the Humber. Hull, Doncaster, Bradford and Barnsley have the highest IMD scores and York, East Riding and North Yorkshire the lowest. As we explore further in following sections there is a strong relationship between relative prosperity and the strength of ‘Big Society’. In terms of the concentration of the least deprived LSOAs and a strong Big Society, a similar relationship is revealed.
Figure 1: Levels of Deprivation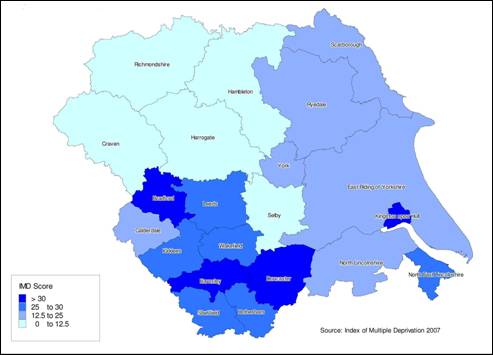
Indeed, to some extent the local authority scores mask the geographic concentration of deprivation in Yorkshire and the Humber. For example, 44 per cent of LSOAs in Hull are ranked in the most deprived 10 per cent nationally. The equivalent figures for Bradford, Doncaster, North East Lincolnshire and Sheffield are all over 20 per cent. The figures for North Yorkshire, East Riding and York are all less than three per cent, as is shown by Figure 2.
Figure 2: Areas with SOAS in most deprived decile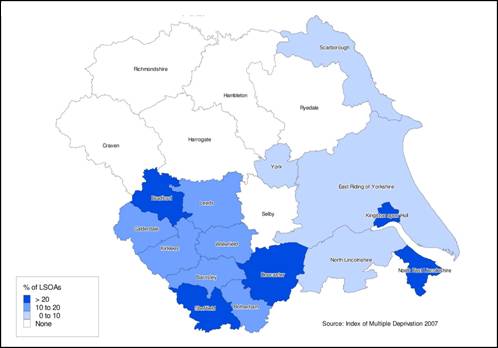
Power and Empowerment
The first theme we consider is that of power and specifically evidence as to the extent to which individuals believe that they can influence decisions which affect their area. A key aspect of the Big Society agenda is around localism and decentralisation: in part to the level of local authorities but also beyond this to communities and people. To some extent these themes were part of the previous Labour government’s policies around empowerment and localism, including double devolution (Lowndes and Sullivan, 2008; Pearson, 2009). Perhaps as a result there has been interest in collecting measures of empowerment.
The most recent and most comprehensive dataset on empowerment comes from the 2008 Place Survey commissioned by the Department for Communities and Local Government (CLG, 2008a). This survey contained two sets of questions relevant to empowerment:
- In terms of influence over local decision making.
- Involvement in local decision making groups, including being a councillor.
Figure 3: Extent of influence over local decision-making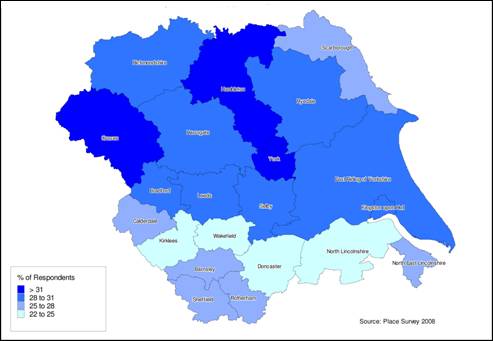
Figure 3 reveals some striking differences with respect to the level of involvement in local decision making. Although the overall Yorkshire and the Humber average is only slightly less than that for England (28 per cent feel that they have influence), there is a considerable range in results across the region, from Craven (34 per cent) to Doncaster (22 per cent). A common reflection is that responses for the metropolitan authorities of South and West Yorkshire are significantly lower than for district councils in North Yorkshire.
The Place Survey also asked whether people would like to be involved more in decision making. Again, the Yorkshire and Humber average (25 per cent) is slightly less than that for England (27 per cent), and there is a considerable range of results across Yorkshire and the Humber. However, the geographic pattern is less clear, with all types of local authority achieving high, average and low scores.
In terms of actual involvement in various decision-making groups the striking and most obvious finding is that on average across Yorkshire and the Humber only around three per cent of people are involved in any particular type of group (e.g. as a school governor or a member of regeneration partnership). Again, this is slightly less than the England average. Of course, what the data do not reveal is whether individuals are members of multiple groups (suggesting that there is a ‘decision making core’ of little more than three per cent) or whether membership is a more ‘dispersed’. If the latter were true, then total involvement would be far greater than this. We suspect that the tendency will be towards a decision making and civic core.
The Place Survey included questions around the following types of decision making group involvement: councillors; health and education; regeneration; crime; tenants groups; young people; other groups. An immediate comment is that opportunities to be involved in decision making will vary markedly across these different types of groups. For instance, there are relatively few opportunities to be a councillor, but more opportunities to participate in an education or health group (such as a school governor or on a patient advisory group). Similarly, it would be anticipated that there would be greater opportunity to participate in regeneration groups in more deprived areas. Comparing involvement across different types of group may therefore not be that helpful.
Figure 4: Formal Involvement in Local Groups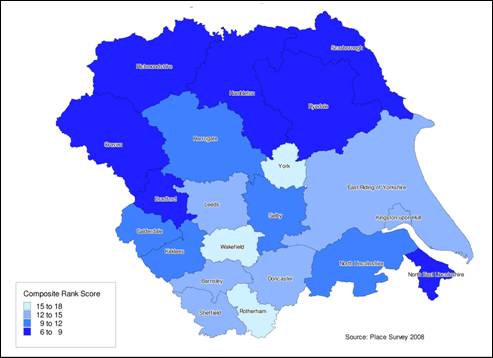
However, exploring variation across places reveals a general pattern of involvement, but also a couple of exceptions. We derived a composite score for each place by ranking its position against each indicator and then taking an average of these ranks. In other words, the lower the composite score, the higher the degree of overall involvement. As Figure 4 reveals, this analysis showed a clear split between rural North Yorkshire districts (higher involvement scores) than metropolitan and unitary authorities. Working hypotheses may suggest that involvement is positively correlated with prosperity, or that smaller, rural places have disproportionately more opportunities to participate. The two notable exceptions are Bradford (placed third out of all Yorkshire and the Humber LADs) and York (placed last). Further explanations could be proposed for these two places ranging from the role of the local authority in stimulating participation (Bradford), the likelihood that all other things being equal ethnic minorities are more likely to participate (Bradford) or that relatively new and affluent population groups are less likely to participate (York). These suggestions are speculative but are supported to some extent by the Citizenship Survey (CLG, 2008b).
Figure 5: Take-up of Formal Roles in Different Types of Local Group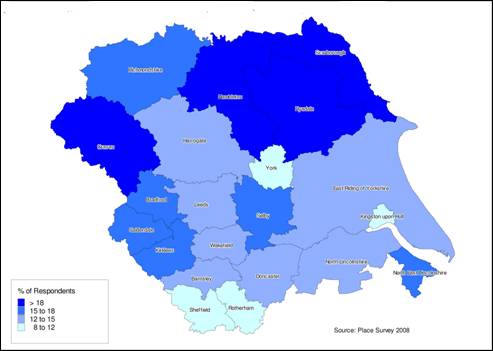
This section has reviewed evidence around the first component of the Big Society, namely power. It is not possible to surmise whether efforts to ‘shift power’ would lead to an increase in the scores discussed above. However, two issues are raised by the data. Firstly, influence and involvement do vary from place to place, and on some indicators quite considerably so, with some evidence that the ‘Big Society’ agenda of power transfer may be more readily taken up in North Yorkshire than in metropolitan authorities in West and South Yorkshire. Secondly, and this issue is returned to later, it may be surmised that in each place there is a ‘civic core’ of empowered and engaged individuals, and that pushing beyond this may prove difficult.
Participation and Involvement
The second component of the Big Society agenda explored here is that of participation and involvement: the core elements of social action. Of course, social action may include many things, and to some extent is defined vaguely by Government as encouraging and enabling people from all walks of life to play a more active part in society. In this section we consider two established proxies of participation and involvement, namely voluntary action and giving.
There have been extensive debates around the measurement of volunteering, for instance what counts as voluntary activity, as well as how data are collected (see for example Gilbertson and Wilson, 2009) and what the findings of the national Place Survey tell us about volunteering (CLG, 2008b). The Place Survey divides evidence on volunteering into the two categories of formal and informal volunteering. Average levels of both formal and informal volunteering in Yorkshire and the Humber are less that in the UK as a whole.
Figure 6: Extent of Volunteering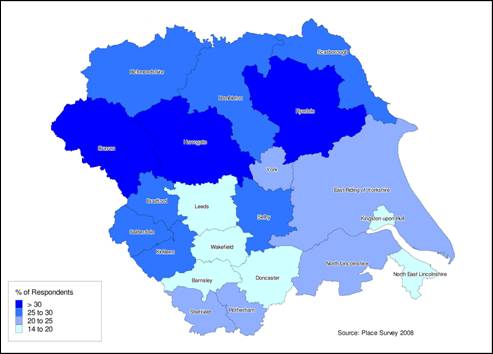
Figure 6 shows the extent of formal volunteering (How often over the last 12 months have you given unpaid help to any group(s), club(s) or organisation(s)?). It shows some significant variation across the region, with relatively high levels across North Yorkshire, and low levels in parts of South and West Yorkshire, as well as Hull and Grimsby. The highest score was for Craven (32.8 per cent of respondents answering who have volunteered at least monthly), and the lowest for Hull (14 per cent of respondents).
Of interest to the promotion of the ‘Big Society’ is an understanding that there are specific types or forms of volunteering and that the motivation of volunteers varies. Unfortunately this information is not available at statistically significant levels for local authority districts. However, the findings for Yorkshire and the Humber as a whole are nonetheless interesting.
Figures in the 2008-9 Citizenship Survey show that nationally 26 per cent of people say they regularly undertake formal volunteering activities at least once a month, whilst 35 per cent say they regularly volunteer on an informal basis. Rates of both regular formal and informal volunteering differ slightly according to the regions in which people live and rates are lower in Yorkshire and the Humber than national figures and than in most other regions.
Nationally the most common activities carried out by regular formal volunteers include ‘organising or helping to run an event’ (59 per cent) and ‘raising or handling money/taking part in sponsored events’ (52 per cent). A quarter of regular formal volunteers dedicate time to ‘providing transport/driving’ (26 per cent), ‘giving information/advice/counselling’ (25 per cent) and ‘visiting people’ (23 per cent).
The analysis of the 2008-09 Citizenship Survey (Drever, 2010) reinforces some quite well established patterns in both formal and informal volunteering, for instance:
- Women are more likely to volunteer than men (for instance 42 percent of women undertook formal volunteering in the last month compared to 39 percent of men.
- Younger people (16-25 year olds) are more likely to volunteer than older people (35-74 year olds), but are more likely to participate in informal volunteering.
- People with higher qualifications are more likely to participate in regular formal volunteering.
These factors, in varying compositions, also explained variation in levels of volunteering between ethnic groups and between places.
In the 2008-9 Citizenship survey information was also collected about charitable donations. Amongst those giving to charity the average amount donated was £17.70 in a typical four week period. 27 per cent of people had given less than £5, while a small proportion (nine per cent) had given £50 or more. Those in higher socio-economic groups donated higher average amounts than all other groups. Those people with jobs classified as ‘higher/lower managerial and professional’ had given an average of £22.95 in the four weeks prior to interview, while those in ‘routine occupations’ had given an average of £11.89.
The proportion of households giving to charity varies considerably by region, with households in Northern Ireland (46.2 per cent) being almost twice as likely to donate as those located in Wales, the West Midlands and North East England. According to the national Living Costs and Food Survey (LCF) 27.7 per cent of households in Yorkshire and the Humber donated to charity in a two week spending diary period. Most other regions recorded higher proportions than this, some considerably so (e.g., 31.7 per cent in the South West, 31.4 in the South East, 30.5 in Eastern England, and 29.5 per cent in Scotland). The only regions with substantially lower levels of giving were the West Midlands and Wales (both 25.1 per cent).
Differences are largely explained by variations in income, and there is a strong positive link between income and the propensity to give across England, Scotland and Wales. In Northern Ireland the importance of religion in people’s lives is likely to increase levels of giving, and proportionately more households donate to charity, regardless of income.
Participation, volunteering and giving are important themes of the Big Society. The analysis shows that there are likely to be marked differences in each of these across Yorkshire and the Humber, although to a large extent this place-based variation is explained by factors such as age, socio-economic group, income and qualification levels.
Civil Society Organisations
The third component of the Big Society considered here is around proposals to develop the civil society sector of co-operatives, mutuals, charities and social enterprises. The focus for this aspect of the Big Society lies in part with the development of the existing sector, but also and critically the potential for it to be expanded through transferring the delivery of public services from the public sector to some form of civil society organisation. Whilst it is not possible to comment on the organisations which may be formed through the latter route, it is possible to reflect on the size, shape and form of existing civil society organisations in Yorkshire and the Humber.
Figure 7: Relative Scale of the Third Sector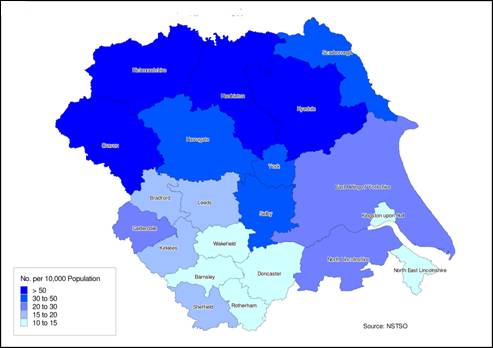
Figure 7 shows the number of third sector organisations per 10,000 the population in each of the LADs in Yorkshire and the Humber, based on the National Survey of Third Sector Organisations. It reveals a marked difference between Doncaster, Barnsley, Hull, Rotherham, North East Lincolnshire and Wakefield (less than fifteen organisations per 10,000 population) and Craven, Richmondshire, Hambleton and Ryedale (all more than 50 general charities per 10,000 population). Indeed, per head of population there are over five times the number of charities in Craven (highest density) than in Wakefield (lowest density).1
Figure 8: Relative Size of Third Sector Income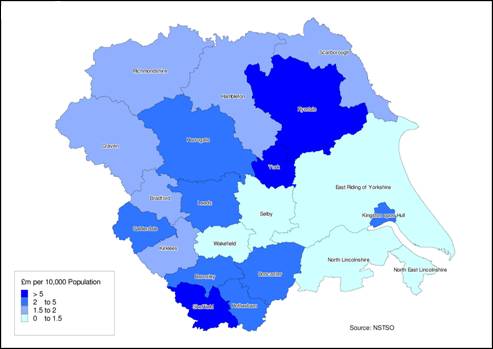
A further way to understand this distribution is to measure the average income of charities in each of these areas in relation to their respective populations (for instance, assuming that larger charities will tend to be located in cities). As might be expected charity income is concentrated in Leeds and Sheffield (43 per cent of total charity income in Yorkshire and the Humber), but in terms of income per 10,000 of the population, the greatest concentrations of charity income are in Ryedale, Sheffield, and York (all more than £7 million per 10,000 of the population, or rather more than £700 per person) (see Figure 8). At the opposite end of the spectrum, charities in North East Lincolnshire and North Lincolnshire receive less than £100 per person in their areas. There are a further nine places which receive between £100-£200 per person (Bradford, Hambleton, Scarborough, Craven, Kirklees, Richmondshire, East Riding, Selby and Wakefield).
Another way to consider the distribution of civil society organisations concerns the extent to which some places have a greater or lesser density of particular types of charity. These patterns largely reflect the preceding analysis, with concentrations of grant making foundations and culture and recreation charities in North Yorkshire, for example.
It is also worth highlighting the vulnerability of charities across Yorkshire and the Humber. Two indicators are of use here: the relative significance of different sources of income; and the ‘reserves’ that charities hold and which potentially could fund expenditure if external income was to reduce or cease. These are crude measures of vulnerability and can mask factors such as the significance of a few very large charities in particular areas (for example, the UfI in Sheffield), or the tendency for fundraising to be a more significant source of income in rural areas.
Chart 1 reveals marked contrasts in the proportion of income from statutory sources across the region. Statutory sources of income are very significant in South Yorkshire, but far less so in East Riding and North and North East Lincolnshire; in both of these areas individual donations account for over 50 per cent of income. The figures suggest that charities in South Yorkshire, Hull, Bradford and York are likely to be harder hit by reductions in public expenditure. Work by Chris Dayson and colleagues identify different types of civil society organisation which may be more vulnerable in Yorkshire and Humber. This suggests that medium sized charities working with disadvantaged groups are more at risk to external funding shocks than other charities (Dayson et al., 2009).
Chart 1: Income sources of general charities in Yorkshire and Humber, 2006/07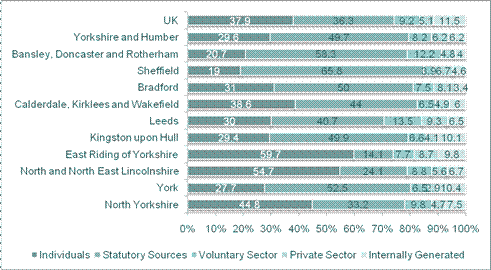
Source: Guidestar Data Services/ Northern Rock Foundation Third Sector Trends study
Chart 2 reveals how resilient charities in particular areas may be to adverse funding shocks. It uses the simple measure of the funds (or reserves) that a charity holds against annual expenditure. The findings reflect the preceding discussion: charities in South Yorkshire still appear to be the most vulnerable according to this measure. At the same time, however, charities in Hull appear to be less vulnerable than their reliance on public funding might otherwise suggest. Two factors may explain this variation: the significance of the University for Industry in Sheffield; and the existence of a few small charities in Hull holding a significant amount of assets. Notably, asset holdings by charities in the ‘Humber’ and North Yorkshire are all very high and at levels comparable to the UK average. The same cannot be said for such bodies in West and South Yorkshire.
Chart 2: Funds held by general charities in Yorkshire and Humber (2006/07) – Years of expenditure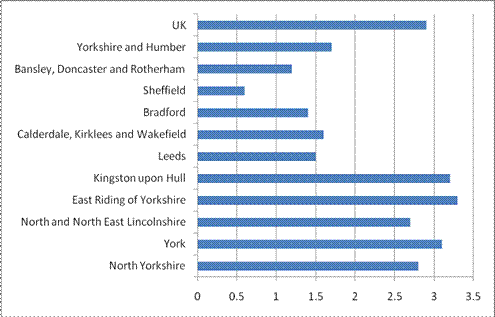
Source: Guidestar Data Services/ Northern Rock Foundation Third Sector Trends study
Admittedly, the figures provide a crude assessment of the vulnerability of charities in the region. One omission is that the analysis does not include ‘below the radar’ organisations or the level of variation within particular places.
Nevertheless, this section has reinforced our findings that Yorkshire and the Humber contains marked contrasts in terms of its base of civil society organisations. Our analysis does not explore ‘below the radar’ organisations (typically small associations and clubs which do not employ staff), although we suspect, given the findings around participation and involvement, that these would tend to reflect the overall findings of greater concentrations of civil society activity in North Yorkshire and in the main cities of Leeds, Sheffield and Bradford.
Discussion
The local areas of Yorkshire and the Humber provide an incredible contrast in terms of the level, density, scope and vibrancy of civil society activities and organisations. Unsurprisingly, agendas to promote a Big Society will play out very differently in these different places. Equally, it cannot be assumed that areas which appear to have weak or few civil society activities and organisations cannot be engaged effectively in this policy agenda; although we suspect that it would be considerably harder. However, a central concern must be that the current design of Big Society policy pays scant attention to these issues of equity between places and their relative access to resources.
Of course, there are variations across Yorkshire and the Humber. Of greatest concern is the narrow base of ‘Big Society’ in places such as Barnsley, Wakefield, Doncaster, North and North East Lincolnshire and Hull. The expectation is that civil society in all the forms discussed here will help to fill gaps in the provision of public sector services. Given the starting point for these areas, this would appear to be a very tall order. The larger cities in Yorkshire and the Humber (Sheffield, Leeds and Bradford), whilst facing high levels of deprivation, do at least start from a position of a relatively broad base of civil society activity, albeit still less than the more prosperous parts of the region.
The following discussion reflects on the evidence presented in this paper and outlines key challenges for the Big Society policy agenda in Yorkshire and the Humber and indeed for other parts of the United Kingdom.
Loss of Organisations, Services and Workforce
The analysis presented is essentially a static one. It shows differences in the concentration of civil society organisations from place to place. We suggest that organisations in certain places may be far more vulnerable to external changes; in particular to cuts in public spending, but also in the way organisations are funded. We discuss this in terms of reserve levels and the concentration of public sector funding as indicators of vulnerability. Previous approaches to funding certain activities in civil society organisations, notably around regeneration, employment support or welfare may have generated a growth in, and a base of, organisations which cannot be sustained in an era of greatly reduced public spending. The map of the concentration of charities and charitable income may undergo remarkable changes over a relatively short time period. Work by Chris Dayson and colleagues has identified different types of civil society organisation which may be more vulnerable in Yorkshire and the Humber (Dayson et al., 2009). More recent work by David Clifford and colleagues finds evidence that organisations in more deprived neighbourhoods receive a higher proportion of their funding from the public sector (Clifford et al., 2010).
The implication of this is that the sector of civil society organisations is undoubtedly undergoing a period of dramatic change, primarily driven by cuts in public expenditure. This has both implications for provision, with gaps emerging as support is withdrawn, and for the size and composition of the sector, with the loss of organisations possibly concentrated in certain parts of the sector, and considerable reductions in the workforce employed in it. Unfortunately the systematic tracking of these changes and the impact they have is inherently difficult, especially in the absence of nationally compiled surveys and datasets. Of course, the sector has never been static and new opportunities may emerge; however, given the significance of public resources in supporting the sector, considerable gaps may emerge.
Moving Beyond the Civic Core
Research in Canada by Reed and Selbee (2001) has shown that there is a remarkable concentration of civic involvement, in terms of volunteering, giving to charity and participation in civic organisations. This they term the “civic core”, with as few as six per cent of Canada’s population contributing between 35 and 42 per cent of Canada’s civic activities.
Our analysis here has drawn on separate datasets around these issues, and as such does not replicate these authors’ work. Nonetheless, what evidence does exist, and what we know more broadly about civic participation in the United Kingdom, suggest that there is almost certainly a civic core in existence across Yorkshire and the Humber. What our findings point to is that this civic core may also vary from place to place and be more prevalent in affluent areas; with of course some notable exceptions in more deprived areas.
Reed and Selbee raise a series of issues for policy makers around their civic core findings. The first is that it would appear that it is difficult to dramatically change the size of the civic core; the majority of the population remain outside this core and engage in civic activities on a far more piecemeal and ad hoc basis. The second issue is to more fully accept the existence of the civic core and understand how it may be engaged more effectively. Nonetheless, there are clearly spatial differences which policy makers should consider. Again, however, the loss of organisations and the enabling infrastructure of the sector may well make efforts to mobilise people (from the core or non-core) more difficult.
Limits of Civic Ties in Improving Outcomes
Discussions around the Big Society have made much of the failure of state-led and ‘top-down’ approaches to stimulate civil society, especially in the context of the regeneration of disadvantaged neighbourhoods. To some extent, this dichotomy is a false one; more recent state-led approaches to regeneration through Area Based Initiatives (ABIs) such as the Single Regeneration Budget but especially New Deal for Communities made much of the ‘community dimension’ and the potential of boosting ‘social capital’.
The evaluation of New Deal for Communities showed, however, that headline measures of social capital failed to move considerably and evidence of significant people-based outcomes (jobs, education and health) was relatively modest in comparison to place-based changes (crime, physical environment and neighbourhood attractiveness).2 The recent RSA Connected Communities report (Rowson et al., 2010) suggests that the failure of ABIs in this regard, including NDC, was that community engagement and participation were of second order importance to the need to spend financial resources and achieve externally set targets.
The RSA report argues that policies, including ABIs, would be greatly improved by an understanding of social networks, and that these cross geographic boundaries. The design and implementation of ABIs, it counters, would be improved not just through better measurement of social networks, but more importantly through actively engaging them in the implementation of policy. These are important lessons, although they continue to suggest that the mobilisation of civic ties will solve problems, for instance in finding a job or improving job prospects. This would appear to neglect the wider geographic contexts of many disadvantaged neighbourhoods in Yorkshire and the Humber. In particular, civic ties may be part of the policy solution but they cannot resolve material poverty and wider issues such as the weak demand for labour.
Time, Resources and Changing the Local State
This paper has argued that the policy agenda for the Big Society may, of course, play out differently from one place to the next. Indeed, the associated agenda of localism would very much encourage and expect such variation. Little attention is given to the timeframes over which change is expected or that some areas may require longer and more resources to effect such change.
Evidence from the National Survey of Third Sector Organisations (NSTSO, 2009) included a question (Taking everything into account, overall, how do the statutory bodies in your local area influence your organisation’s success?), from which was derived a score for local authority districts. This was used as the baseline measure for National Indicator 7 (NI7) on a Thriving Third Sector. The results from this highlight the relationship between the local state (local authority but also other public sector agencies) and the voluntary and community sector. They also provide a measure of the health of this relationship. Overall the score for Yorkshire and Humber was around 16 per cent, but with variation from 13.5 per cent (Barnsley) to 20.4 per cent (Hull).
What is striking about the variation in results for Yorkshire and the Humber local authorities is that, unlike previous sections of this paper, there are no obvious groupings of local authorities by type, location or relative prosperity. Analysis of the survey data at a national level suggests that a series of drivers are at play, including the ability of organisations to influence decisions, the state of current relationships, the value the statutory sector places on the third sector and the satisfaction of support. To some extent these are not mutually exclusive questions, and also reflect some weaknesses in NI7 as an indicator (Ipsos MORI, 2009). Although important for providing a national summary of key drivers, local factors also appear to play a strong part.
Further research on the NSTSO dataset is more revealing. Research by David Clifford and colleagues (Clifford et al., 2010) show there are considerable differences in the proportion of organisations receiving funding from the state. This ranges from Hull (51 per cent of organisations) through to North Yorkshire (32 per cent). Regardless of the scale of this funding, this shows hugely significant differences between places regarding the role of the state (largely at a local level) and civil society organisations.
In some places there appears to be considerable independence of organisations (East Riding and North Yorkshire have fewer than 35 per cent organisations funded by the state in some way), in comparison to Hull, Doncaster, Sheffield, Calderdale, Bradford, Leeds, Rotherham, North East Lincolnshire and Barnsley where over 40 per cent of organisations are state funded. The national average is 36 per cent. Understanding these relationships, including those beyond issues of funding, will be important for understanding the role of the state in stimulating a Big Society.
Conclusion
Alongside public sector cuts and localism, the Big Society may become a defining theme of the Coalition Government. Indeed to a large extent the two go hand-in-hand and are part of a redefinition of the role of the state in civic life.
This paper has sought to provide an initial, largely quantitative assessment of the Big Society in Yorkshire and the Humber. It finds considerable variation between places, especially in terms of the scale and extent of civil society. Such variation should raise some concern for policy makers, perhaps not unexpectedly, as to the reception of the Big Society. The Big Society agenda pays almost no attention to social and economic differences between places, and, of more concern, that a withdrawal of the state through public expenditure cuts is only likely to exacerbate these differences.
Further and far more detailed quantitative and qualitative analysis will be required to evaluate the impact of the Big Society in Yorkshire and the Humber and other regions. For the moment, this is a starting point.
1 Data on the population of general charities in Yorkshire and Humber was accessed from The Northern Rock Third Sector Trends Study. The Yorkshire and Humber Forum is a participating partner in this study. Original data was provided by Guidestar Data Services.
2 The full set of NDC evaluation reports is available here: http://extra.shu.ac.uk/ndc/ndc_reports_02.htm
This paper draws on an earlier published report of the same name. This report is available at: www.shu.ac.uk/_assets/pdf/cresr-big-society-in-Yorkshire-and-Humber-final-report.pdf. We are very grateful to all those who participated in this research project. The research was funded under the ESRC Third Sector Research Fellows Pilot Programme (Award: RES-173-27-0195) and involved Mark Crowe (Head of Development Yorkshire and Humber Forum) being seconded to the Centre for Regional Economic and Social Research (CRESR), Sheffield Hallam University. As Fellow, Mark worked in conjunction with Professor Peter Wells, Jan Gilbertson and Dr Tony Gore at CRESR. Mark’s work developed earlier data gathering and analysis undertaken by his colleague Andrew Scott at the Yorkshire and Humber Forum. I am also grateful to my colleague Chris Dayson for comments on the draft paper and to Dr Rob Macmillan (Third Sector Research Centre, University of Birmingham) for comments and suggestions for further reading. The findings and conclusions presented however remain the responsibility of the authors.
Peter Wells, CRESR, Sheffield Hallam University, Unit 10 Science Park, Howard Street, Sheffield, S1 1WB. Email:p.wells@shu.ac.uk
Armstrong, H.W. and Wells, P. (2006) The Structural Funds and the Evaluation of Community Economic Development Initiatives: A United Kingdom Perspective. Regional Studies, 40, 2, 259-272. CrossRef link
Cabinet Office (2010), Building a Stronger Civil Society. Available at: www.cabinetoffice.gov.uk/media/409088/pfg_coalition.pdf
Clark, J., Kane, D., Wilding, K. and Wilton, J. (2010) The UK Civil Society Almanac 2010. London.
Clifford, D., Geyne Rajme, F. and Mohan, J. (2010) How dependent is the third sector on public funding? Evidence from the National Survey of Third Sector Organisations. TSRC Working Paper 45.
Communities and Local Government (2008a) Place Survey. Results from the Place Survey were accessed through the Economic and Social Data Service. More details about the Place Survey are available at: www.communities.gov.uk/publications/corporate/statistics/placesurvey2008
Communities and Local Government (2008b) Citizenship Survey. Results from the Citizenship Survey were accessed through the Economic and Social Data Service. More details about the Place Survey are available at: www.communities.gov.uk/publications/corporate/statistics/citizenshipsurveyq1201011
Dayson, C., Hems, L., Wells, P. and Wilson, I. (2009) Impact of the Recession of the Third Sector: an initial quantitative assessment. Birmingham: Capacitybuilders.
Drever, E. (2010) 2008-09 Citizenship Survey: Volunteering and Charitable Giving Topic Report. London: CLG. Report accessed from: www.communities.gov.uk/publications/corporate/statistics/citizenshipsurvey200708volunteer
Gilbertson, J. and Wilson, I. (2008) Measuring participation at a local level: be careful what you ask for! People, Place & Policy Online, 2, 2, 78-91. Article available at: https://ppp-online.org/issue_2_290709/documents/measuring_
participation_local_level.pdf
Ipsos MORI (2009) National Survey of Third Sector Organisations,Analytical Report: Key Findings from the Survey. London: Cabinet Office.
Lowndes, V. and Sullivan, H. (2008) How Low can you go? Rationales and Challenges for Neighbourhood Governance. Public Administration, 86, 1, 53-74. CrossRef link
Reed, P.B. and Selbee, L.K. (2001) The Civic Core in Canada: Disproportionality in Charitable Giving, Volunteering, and Civic Participation. Nonprofit and Voluntary Sector Quarterly, 30, 4, 761-780. CrossRef link
Rowson, J., Broome, S. and Jones, A. (2010) Connected Communities: How social networks power and sustain the Big Society. Accessed from: www.thersa.org/projects/connected-communities